Send actions to chart with a Toolbar widget
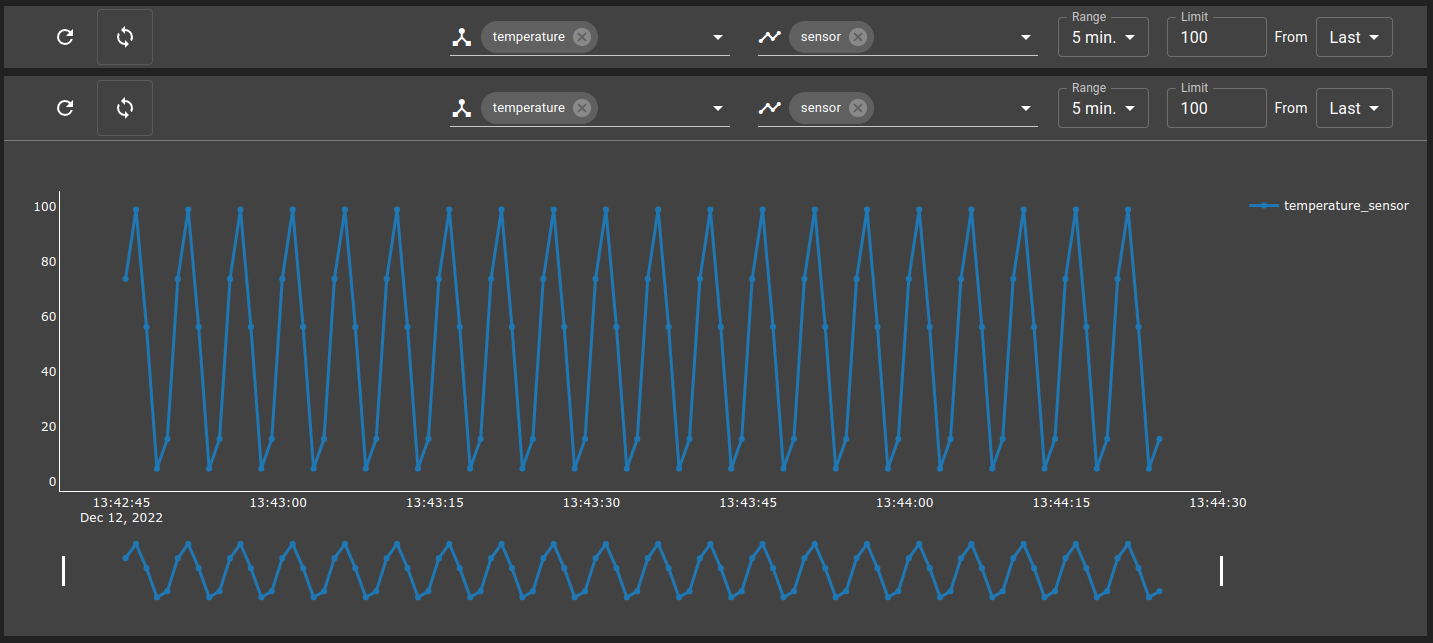
This example shows how to use a Toolbar widget to broadcast filter or zoom actions to subscribed chart widgets in a dashboard.
Start from an existing charts dashboard (see the visualize_charts example).
Add a Toolbar widget and subscribe chart widgets to it using
widgetSubscriptions.Use a BoxLayout to minimize the Toolbar height without affecting its communication role.
Verify that filter changes on the Toolbar are reflected in real time on all subscribed charts.
git checkout origin/osp-web-configuration .
git checkout origin/osp-analytics-configuration .
git checkout origin/osp-waveforms-configuration .
git checkout origin/example-dashboard-charts .
Steps
1. Create a dashboard with charts
To complete this step, you can follow the Visualize queries data within charts or you can directly get the example using the following command :
git checkout origin/example-dashboard-charts .
2. Create a Toolbar widget and subscribe to it
Toolbars will send their actions to any chart that subscribed on it. In order to subscribe to a widget, you need to set the widgetSubscriptions property with the id of the toolbar widgets. Charts widgets can be subscribed to multiple toolbars.
In this example, we use a BoxLayout to minimize the height of the toolbar, but it doesn’t affect anything in relation with the communications between the widgets.
root/dashboards/examples/toolbar/dashboard.view
{
    "configuration": [
        {
            "type": "BoxLayout",
            "id": "a",
            "title": "",
            "boxLayoutWidgetSettings": {
                "orientation": "Vertical",
                "components": [
                    {
                        "component": {
                            "type": "Toolbar",
                            "id": "b",
                            "title": "",
                            "toolbarWidgetSettings": {
                                "type": "Chart"
                            }
                        },
                        "size": 0.1
                    },
                    {
                        "component": {
                            "type": "Chart",
                            "id": "c",
                            "title": "Chart",
                            "widgetSubscriptions": ["b"],
                            "chartWidgetSettings": {
                                "query": "root.analytics.query.examples.charts",
                                "type": "Line",
                                "toolbar": {
                                    "type": "Toolbar",
                                    "id": "d",
                                    "title": "",
                                    "toolbarWidgetSettings": {
                                        "type": "Chart"
                                    }
                                }
                            },
                            "options": {
                                "userPreference": "LOCAL_STORAGE"
                            }
                        },
                        "size": 0.9
                    }
                ]
            }
        }
    ],
    "layout": {
        "lg": [
            {
                "w": 12,
                "h": 4,
                "x": 0,
                "y": 0,
                "i": "a"
            }
        ]
    },
    "breakpoints": {
        "lg": 1200,
        "md": 996,
        "sm": 768,
        "xs": 480,
        "xxs": 0
    },
    "cols": {
        "lg": 12,
        "md": 10,
        "sm": 6,
        "xs": 4,
        "xxs": 2
    }
}
3. Push the configuration to the osp-configuration-dispatcher
git add .
git commit -m "Add new toolbar widget"
git pull
git push
4. Refresh the dashboard
If you try to change a filter in the toolbar, you should see the chart below change.
Add this example in your configuration
You can directly use the following command to add this example into your configuration :
git checkout origin/example-dashboard-charts-toolbar .