Visualize list of alarms
This example shows how to create a dashboard with an alarm table widget to display and manage active alarms from a web browser.
Create a dashboard with
dashboard.webanddashboard.viewfiles.Add an alarm table widget via the dashboard edit mode and configure it interactively.
Export the widget layout from the describe view and commit it to the configuration repository.
Push the updated
dashboard.viewto display the live alarm table in the browser.
git checkout origin/osp-alarms-configuration .
git checkout origin/osp-web-configuration .
git checkout origin/example-dashboard-alarm-table .
Steps
In the configuration :
1. Create a new empty dashboard
root/dashboards/alarm/dashboard.web
{
    "moduleId": "modules.web.web-1",
    "title": "Tutorial dashboard",
    "description": "Tutorial dashboard",
    "tags": ["Tutorial"]
}
root/dashboards/alarm/dashboard.view
{
    "configuration": [
    ],
    "layout": {
        "lg": []
    }
}
2. Push the configuration to the osp-configuration-dispatcher
git add .
git commit -m "Add new dashboard"
git pull
git push
1. Login to the dashboard and select previously created dashboard
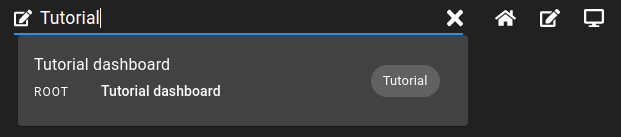
4. Click on the edit dashboard button and add a new “Alarm table” widget
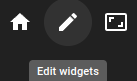
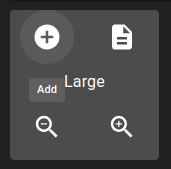
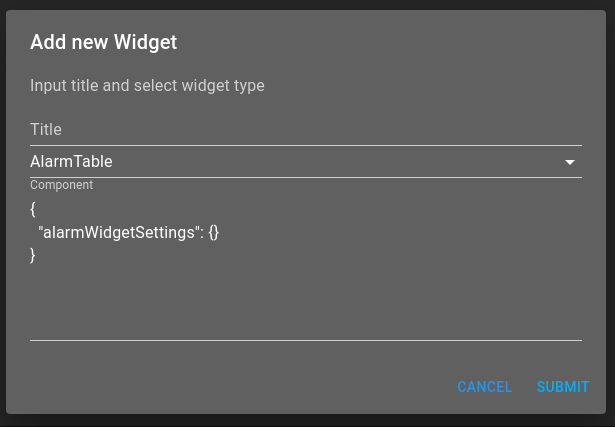
Click on the validate button.
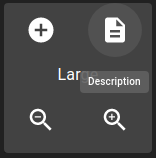
6. Click on the edit dashboard button once again, click on the description button and copy its content
It should be something like
root/dashboards/alarm/dashboard.view
{
    "configuration": [
        {
            "type": "AlarmTable",
            "id": "amq94Tog",
            "title": "",
            "alarmWidgetSettings": {
                "defaultFilter": "root.alarms.filters.all",
                "defaultView": "root.alarms.views.default"
            }
        }
    ],
    "layout": {
        "lg": [
            {
                "w": 12,
                "h": 4,
                "x": 0,
                "y": 0,
                "i": "amq94Tog"
            }
        ]
    },
    "breakpoints": {
        "lg": 1200,
        "md": 996,
        "sm": 768,
        "xs": 480,
        "xxs": 0
    },
    "cols": {
        "lg": 12,
        "md": 10,
        "sm": 6,
        "xs": 4,
        "xxs": 2
    }
}
7. Replace the previous content of the dashboard.view file by the content copied in the previous step, and push the modifications
git add .
git commit -m "Add alarm widget"
git pull
git push
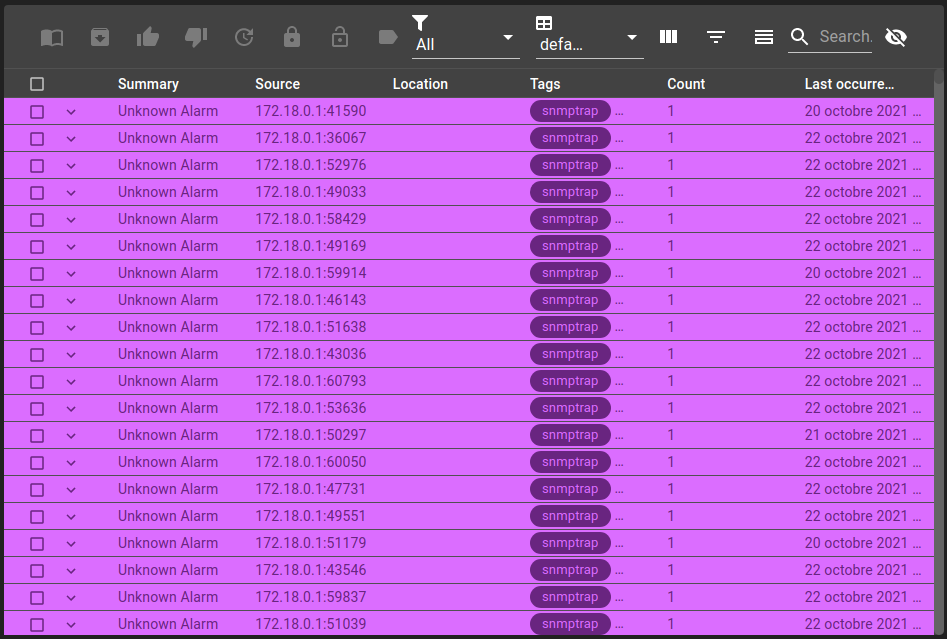
8. Refresh the dashboard
Add this example in your configuration
You can directly use the following command to add this example into your configuration :
git checkout origin/example-dashboard-alarm-table .