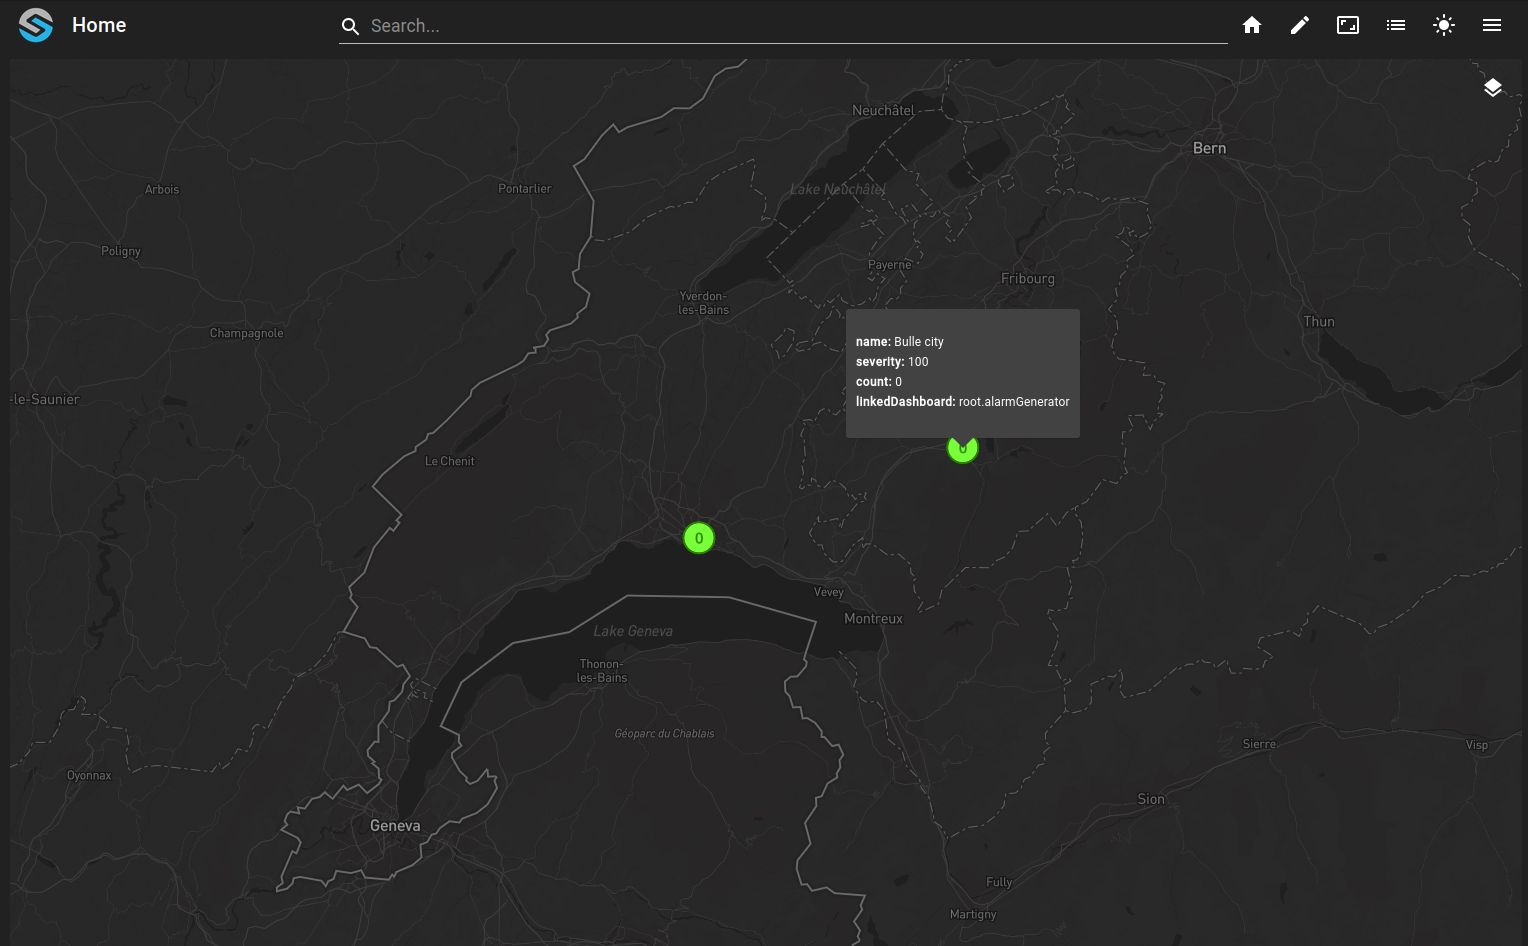
Display alarm points on map
This example shows how to display alarm points on a map by linking alarm filters and aggregated values to geographic sites.
Create
geo.mapsfiles for each site and link them to alarm count and highest-severity values.Configure a complete alarm layer using the three files
layer.ospp,layer.maps, andlayer.web.Display the layer in a dashboard map widget.
Use alarm filters and
owner.alarmsto track per-site alarm counts and severity.
git checkout origin/osp-alarms-configuration .
git checkout origin/osp-web-configuration .
git checkout origin/osp-maps-configuration .
git checkout origin/osp-variables-configuration .
git checkout origin/osp-scripts-configuration .
git checkout origin/example-maps-display-alarms .
Learning goals
How to configure values linked to
geo.mapsfile.How to configure a complete layer (the three files
layers.web,layers.mapsandlayers.ospp).How to display on a dashboard using the map widget.
Description
The Maps module lets users display GeoJSON support data on a map. Static geographic elements are usually declared inside geo.maps files. Once a geometry is declared, every value below it in the configuration tree inherits it until another geo.maps file is found. Collection-backed and alarm-backed layers can also stream GeoJSON directly instead of inheriting it from geo.maps. To expose a layer, you typically declare three files:
layer.weblayer.mapslayer.ospp
The layer.ospp file is the main one for the examples in this section. It declares the layer type, the value type, and the mapSources used to populate it.
Configuration structure
![@startuml
skinparam backgroundColor transparent
package "modules" as modules {
node ospweb as "osp-web"
node ospmaps as "osp-maps"
}
package "root" as root {
[dashboard.view] as dashboardview
package "layers" as mapLayers {
package "alarms" as alarmsLayer{
[layer.ospp] as layerospp
[layer.maps]
[layer.web]
}
}
package "site" as site {
package "lausanne" as lausanne {
package "alarms" as lausanneAlarms {
[filters] as lausanneFilters
[highestSeverityValue] as highLausanne
[countValue] as countLausanne
}
[geo.maps] as lausanneGeoMaps
}
package "bulle" as bulle {
package "alarms" as bulleAlarms {
[filters] as bulleFilters
[highestSeverityValue] as highBulle
[countValue] as countBulle
}
[geo.maps] as bulleGeoMaps
}
}
}
ospmaps -[#black]-> bulleGeoMaps : **Own**
ospmaps -[#black]-> lausanneGeoMaps : **Own**
lausanneGeoMaps -[#black]-> highLausanne: **linked**
lausanneGeoMaps -[#black]-> countLausanne: **linked**
bulleGeoMaps -[#black]-> highBulle: **linked**
bulleGeoMaps -[#black]-> countBulle: **linked**
ospweb -[#black]-> dashboardview : **Own**
dashboardview -[#black]-> alarmsLayer : **Display in widget**
layerospp -[#black]u-> highLausanne : **Configured to be displayed**
layerospp -[#black]u-> countLausanne : **Configured to be displayed**
layerospp -[#black]u-> highBulle : **Configured to be displayed**
layerospp -[#black]u-> countBulle : **Configured to be displayed**
@enduml](../_images/plantuml-5e14791fb46084dc49b83aec7abdd39ac551ef04.png)
Steps
Warning
Generate your own Mapbox API token in this example. Place it in module.web file.
1. Create the dashboard
The dashboard is the graphic frontend used to visualize the map.
{
  "configuration": [
    {
      "id": "Lo-_-jGf",
      "type": "Maps",
      "title": "",
      "mapsWidgetSettings": {
        "layerOptions": [
          {
            "layerId": "root.layers.alarms",
            "activatedByDefault": true
          }
        ],
        "mapStyle": {
          "dark": "mapbox://styles/mapbox/dark-v11",
          "light": "mapbox://styles/mapbox/light-v11"
        },
        "centerPosition": [
          7.153656,
          46.80603
        ],
        "zoomLevel": 9
      }
    }
  ],
  "layout": {
    "lg": [
      {
        "w": 12,
        "h": 6,
        "x": 0,
        "y": 0,
        "i": "Lo-_-jGf"
      }
    ]
  },
  "breakpoints": {
    "lg": 1200,
    "md": 996,
    "sm": 768,
    "xs": 480,
    "xxs": 0
  },
  "cols": {
    "lg": 12,
    "md": 10,
    "sm": 6,
    "xs": 4,
    "xxs": 2
  },
  "rowHeight": 150
}
{
    "moduleId": "modules.web.web-1",
    "title": "Home",
    "description": "OnSphere home",
    "tags": []
}
2. Create the different sites with their alarms and their geo.maps file
{
    "geoJsonString": {
        "type": "Feature",
        "geometry": {
          "type": "Point",
          "coordinates": [7.0567, 46.6195, 450]
        },
        "properties": {
          "name": "Bulle city"
        }
      },

    "moduleId": "modules.maps.maps-1"
}
{
    "geoJsonString": {
        "type": "Feature",
        "geometry": {
          "type": "Point",
          "coordinates": [6.633597, 46.519962, 250]
        },
        "properties": {
          "name": "Lausanne"
        }
      },

    "moduleId": "modules.maps.maps-1"
}
Note
To create the complete alarms suite you can refer to the alarm module and alarm examples. But note that the two sites have some values already configured.
{
    "filterId": "root.site.bulle.alarms",
    "type": "ALARM_COUNT"
}
{
    "filterId": "root.site.bulle.alarms",
    "type": "MAX_SEVERITY"
}
{
    "filterId": "root.site.lausanne.alarms",
    "type": "ALARM_COUNT"
}
{
    "filterId": "root.site.lausanne.alarms",
    "type": "MAX_SEVERITY"
}
3. Configure the layer
Note
In this example we point our clicks to a root.alarmGenerator dashboard that let’s you test alarms displayed on the map by generating or changing some. It is optional.
{
    "name": "Alarm layer",
    "description": "",
    "layerType": "SEVERITY",
    "valueType": "POINT",
    "mapSources": [
        {
            "type": "STATIC",
            "severityConfigurations": [
                {
                    "severity": "root.site.bulle.alarms.highest_severity",
                    "count": "root.site.bulle.alarms.count",
                    "dashboard": "root.alarmGenerator"
                },
                {
                    "severity": "root.site.lausanne.alarms.highest_severity",
                    "count": "root.site.lausanne.alarms.count",
                    "dashboard": "root.alarmGenerator"
                }
            ]
        }
    ]
}
{
    "moduleId": "modules.maps.maps-1"
}
{
    "moduleId": "modules.web.web-1"
}
4. Result of the example