Troubleshooting
A new certificate was pushed in the configuration but the certificate is still not used by the module.
Adding a certificate (CA) does not restart the modules because each new module creates a new CA sent to all modules on the SWARM. To add a certificate to a given module:
Push the certificate on the configuration
Restart all the modules to let them fetch the new CA
Why am I experiencing packet dropping, and what are the solutions?
The problem can arise in highly demanding stacks, especially when thousands of devices are simultaneously transmitting data.
There isn’t a one-size-fits-all solution to this issue. In certain cases, such as SNMP-TRAP, the bottleneck often lies with the operating system’s ability to efficiently transfer data from the network driver to the user level at the same rate as incoming packets. For more insights on this topic, refer to the network tuning section.
In instances of heavy data bursts, a recommended best practice is to distribute the workload across multiple hosts using multiple modules.
Frontend issue after upgrading
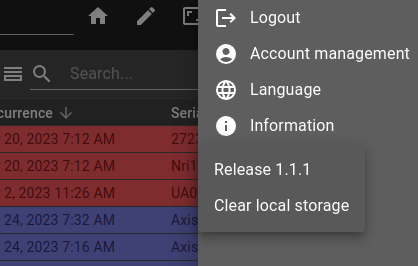
After some upgrade, in some edge cases, the user preferences stored locally could conflict with the new version of the frontend and cause problems. To resolve this issue, you can clear the local storage by accessing it through the side panel menu.
RTSP broken video
From Kurento server documentation (https://readthedocs.org/projects/doc-kurento/downloads/pdf/stable/ chapter 12.6.1)
Note
Some users have reported huge macro-blocks or straight out broken video frames when using a PlayerEndpoint to receive an RTSP stream containing H.264 video. A possible solution to fix this issue is to fine-tune the PlayerEndpoint’s networkCache parameter. It basically sets the buffer size (in milliseconds) that the underlying GStreamer decoding element will use to cache the stream.
There’s no science for that parameter, though. The perfect value depends on your network topology and efficiency, so you should proceed in a trial-and-error approach. For some situations, values lower than 100ms has worked fine, some users have reported that 10ms was required to make their specific camera work, others have seen good results with setting this parameter to 0ms.
Video streaming problem
We can start by checking if ICE has answers to its queries.
Note
In the context of real-time communications (e.g., for video calls or instant messaging), an “ICE candidate” is an IP address and port that can be used to establish a direct connection between two computers on the Internet. When a client wants to connect to another client, it can send a connection offer that includes several “ICE candidates” that can be used to establish the connection. The remote client will respond with a reply that also includes a list of its own “ICE candidates”. The two clients will then exchange their “ICE candidates” until they find a common set they can use to establish a direct connection. “ICE candidates” can include private IP addresses, public IP addresses, or relay IP addresses, depending on which the clients need to use to connect. The process of selecting an appropriate “ICE candidate” can be complex, but it is essential for enabling high-quality real-time communication between clients.
You can start by checking whether ICE requests are answered with the Google Chrome inspection tool.
Go to Google’s inspection tool
Go to tab Network
Filter: WS

Then you will see all the websocket requests clicked on the video request.

In case ICE doesn’t have a return request you will see this as data, there will be no response to the request the video on the dashboard makes
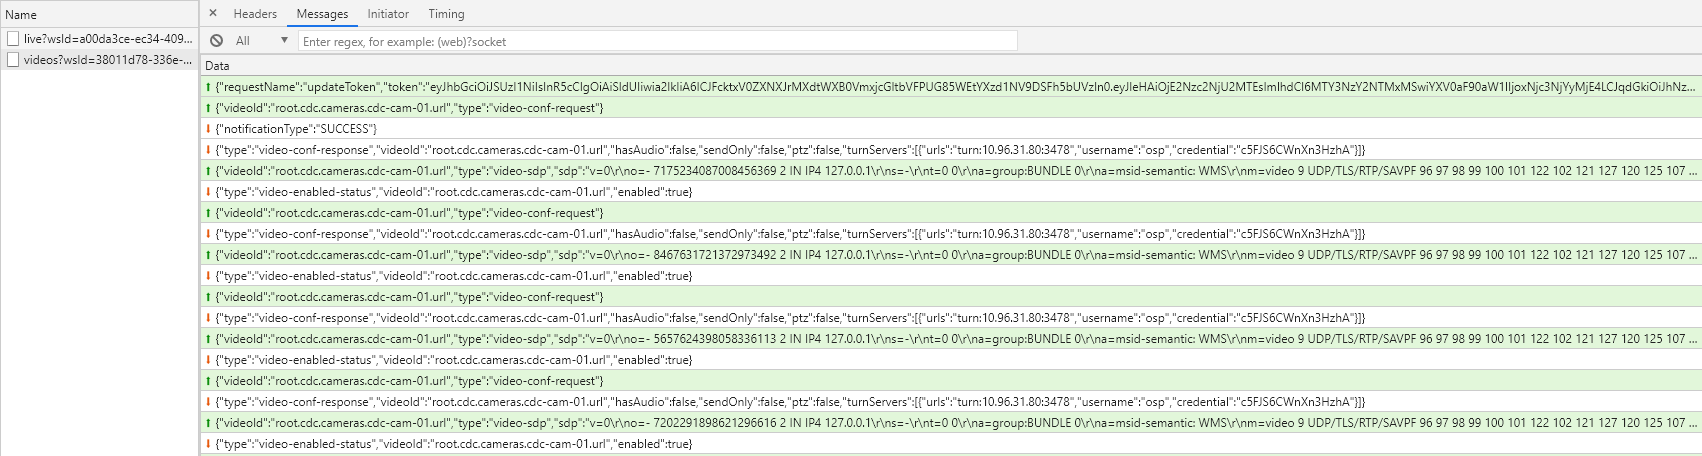
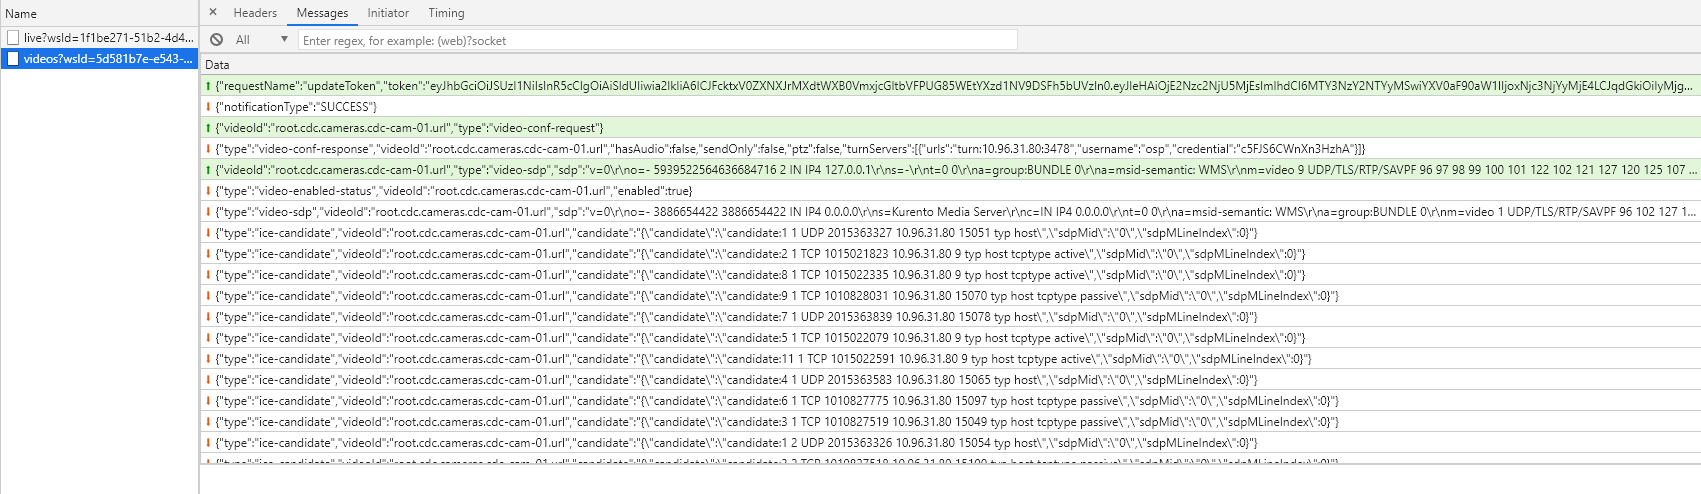
In case there are answers to the requests of the stream requested by the dashboard, you will see ice-candidate in the requests with a protocol, ip etc…
Url not properly encoded
When this happens, there will be no “ICE candidates” on the request.
Warning
Kurento supports only URL-encoded user and password.
rtsp://osp:9d[7xh3.#BDUT-m8n4J@10.10.10.10/onvif-media/media.amp should be rtsp://osp:9d%5B7xh3.%23BDUT-m8n4J@10.10.10.10/onvif-media/media.amp
We can see that some characters have been replaced by % in the encoded URL. Here is an explanation to help detect a non-encoded URL, most of the time, and in the case above, it would be especially the password which poses a problem.
Note
To determine if a URL is encoded or not in English, you can look for special characters that have been replaced by escape codes (e.g. %20 for a space), or if it contains non-ASCII characters that have been encoded in UTF-8. Here are some clues that can help you determine if a URL is encoded in English: The presence of special characters such as spaces, quotes, apostrophes, question marks, etc. If these characters are replaced by escape codes, it indicates that the URL has been encoded. The presence of non-ASCII characters, such as letters with accents or symbols. If these characters are encoded in UTF-8, it also indicates that the URL has been encoded. The absence of special characters or non-ASCII characters. If the URL contains only letters, numbers, and basic punctuation characters, it is likely that it has not been encoded. It is important to note that even if a URL does not appear to be encoded, it is still possible that it contains characters that can cause problems when sending HTTP requests or displaying the corresponding page. Therefore, it is recommended to use URL encoding tools to avoid these issues.
There are several ways to encode URLs:
Software installed locally on your computer such as Utilso (https://utilso.com/)
With a VBA64 code for Excel (https://www.source-code.biz/snippets/vbasic/Base64Coder.bas.txt)
With PowerShell:
Decoding:
Decoding the base64 encoded blob using PowerShell is simple.

$EncodedText = “VABoAGkAcwAgAGkAcwAgAGEAIABzAGUAYwByAGUAdAAgAGEAbgBkACAAcwBoAG8AdQBsAGQAIABiAGUAIABoAGkAZABlAG4A”
$DecodedText = [System.Text.Encoding]::Unicode.GetString([System.Convert]::FromBase64String($EncodedText))
$DecodedText
With online encoders (not recommended, especially if you have to put the complete URL with the password) https://www.urlencoder.org/
Recover GIT after corruption
In some borderline cases, such as file system corruption, the system may be corrupted and make the dispatcher inaccessible. In this case, the system must be manually recovered.
Note
The following method must be done when the dispatcher is continually rebooting.
The first step is to remove the osp-configuration-dispatcher service, either from the portainer or with the command line
docker service rm osp-stack-1_modules_configuration-dispatcher_main
1. Access to GIT
Case 1 : The git is mounted on the host system, in this case, it is enough to restore it locally.
Case 2 : The git is only available on docker volume, in this case we can create a service to restore the system :
With osp-configuration-dipatcher:2.1.2 (add the correct version and repository)
docker container run -it --mount src=osp-stack-1_osp-git,dst=/git -u root osp-configuration-dispatcher:<version> /bin/bash
If you don’t have access to the host, but only to the portainer, use the service creation tabs and set the command to sleep 7200 to have time to debug the system.
2. Restore GIT state
Check the status of git :
git status
The branch should be master, with no changes. If there are changes, undo them (make sure you have a local copy of your work, and save the GIT before the changes).
git reset --hard
git checkout master
Index corruption : If the index is corrupted, delete it and reinsert the files if necessary. Beware that this type of recovery may create an out-of-sequence state with your local working copy. In this case, it is easier to re-clone the git and push your change manually.
3. Re-enable osp-configuration-dispatcher
Log in to the portainer, in the stack tab, in the stack file of osp-stack-1 and re-apply.
Slow alarms
The MongoDB log might contain information about some queries that are slow. You can find them by searching for Slow query.
Note
By default, each query taking more than 100ms is considered as slow. This can be changed by running the following command:
db.runCommand({profile: 0, slowms: 1000})
The slow query log is a JSON string with the following format.
  1{
  2  "t": {
  3    "$date": "2022-06-01T12:17:01.307+00:00"
  4  },
  5  "s": "I",
  6  "c": "COMMAND",
  7  "id": 51803,
  8  "ctx": "conn6622",
  9  "msg": "Slow query",
 10  "attr": {
 11    "type": "command",
 12    "ns": "alarms.deduplicated",
 13    "command": {
 14      "find": "deduplicated",
 15      "filter": {
 16        "$and": [
 17          {
 18            "additionalData.maintenance": {
 19              "$exists": true
 20            }
 21          },
 22          {
 23            "$or": [
 24              {
 25                "additionalData.maintenance": {
 26                  "$ne": "Normal"
 27                }
 28              },
 29              {
 30                "$and": [
 31                  {
 32                    "summary": "Site under maintenance"
 33                  },
 34                  {
 35                    "severity": {
 36                      "$ne": 0
 37                    }
 38                  }
 39                ]
 40              },
 41              {
 42                "$and": [
 43                  {
 44                    "summary": "Device under maintenance"
 45                  },
 46                  {
 47                    "severity": {
 48                      "$ne": 0
 49                    }
 50                  }
 51                ]
 52              }
 53            ]
 54          }
 55        ]
 56      },
 57      "batchSize": 2147483647,
 58      "$db": "alarms",
 59      "$clusterTime": {
 60        "clusterTime": {
 61          "$timestamp": {
 62            "t": 1654085815,
 63            "i": 58
 64          }
 65        },
 66        "signature": {
 67          "hash": {
 68            "$binary": {
 69              "base64": "AAAAAAAAAAAAAAAAAAAAAAAAAAA=",
 70              "subType": "0"
 71            }
 72          },
 73          "keyId": 0
 74        }
 75      },
 76      "lsid": {
 77        "id": {
 78          "$uuid": "436af056-e784-44ea-b249-3391ec708791"
 79        }
 80      }
 81    },
 82    "planSummary": "IXSCAN { summary: 1 }, IXSCAN { summary: 1 }, IXSCAN { additionalData.maintenance: 1 }",
 83    "keysExamined": 140929,
 84    "docsExamined": 140928,
 85    "cursorExhausted": true,
 86    "numYields": 140,
 87    "nreturned": 0,
 88    "queryHash": "43D1A392",
 89    "planCacheKey": "775884E3",
 90    "reslen": 233,
 91    "locks": {
 92      "ReplicationStateTransition": {
 93        "acquireCount": {
 94          "w": 141
 95        }
 96      },
 97      "Global": {
 98        "acquireCount": {
 99          "r": 141
100        }
101      },
102      "Database": {
103        "acquireCount": {
104          "r": 141
105        }
106      },
107      "Collection": {
108        "acquireCount": {
109          "r": 141
110        }
111      },
112      "Mutex": {
113        "acquireCount": {
114          "r": 1
115        }
116      }
117    },
118    "storage": {},
119    "protocol": "op_msg",
120    "durationMillis": 217
121  }
122}
In the previous log extract, we have the following fields that help determine the impact of the query.
Field |
Description |
Line |
|---|---|---|
durationMillis |
The duration of the request. |
120 |
planSummary |
Indicates which fields are scanned by MongoDB. ( |
82 |
keysExamined |
The number of indexes examined. |
83 |
docsExamined |
The number of documents examined. |
84 |
command |
Shows the command executed. |
13 |
In the log provided by MongoDB, we can see the docsExamined field is not 0, which implies that MongoDB needed to scan the document (read the database content) to filter it.
The planSummary field indicates which parts of the document were scanned.
In this specific case, MongoDB needed to check the equality for the summary and additionalData.maintenance fields with a string (see lines 26, 32, and 44).
The index exists for both fields as shown by the IXSCAN on the planSummary, but by default the index does not handle the text field (it only checks the existence of the field).
To improve the situation, you can add the following index to index a text field and improve the equality check between string.
{
  "name": "textual",
  "index": {
    "additionalData.maintenance": "text",
    "summary": "text"
  }
}
To the deduplicatedIndexes list on the module.alarms file.
Stress tests
Disclaimer
While designed to be as efficient and lightweight as possible, OnSphere is still a complex system. It can run a lot of operations at the same time and depending on the amount of said operations, their nature and complexity, the system can appear a bit slow.
It is important to identify where this slowdown comes from to have a chance of addressing it. Being able to identify bottlenecks requires a deep understanding of OnSphere’s internal workings.
No two systems are identical, and therefore it is nearly impossible to provide a foolproof one-size-fits-all solution to stress test a system and measure its behavior.
That being said, there are obviously some considerations which should always be kept in mind when trying to identify the source of slowdowns:
network communication
disk writing
computational loop
The goal of this document is to guide you through a simple example showing the kind of reasoning needed to diagnostic performances issue so that you can assess your own system and its configuration.
Test example description
Test setup example:
We are going to use a configuration running some plugins in addition to (always present) core modules:
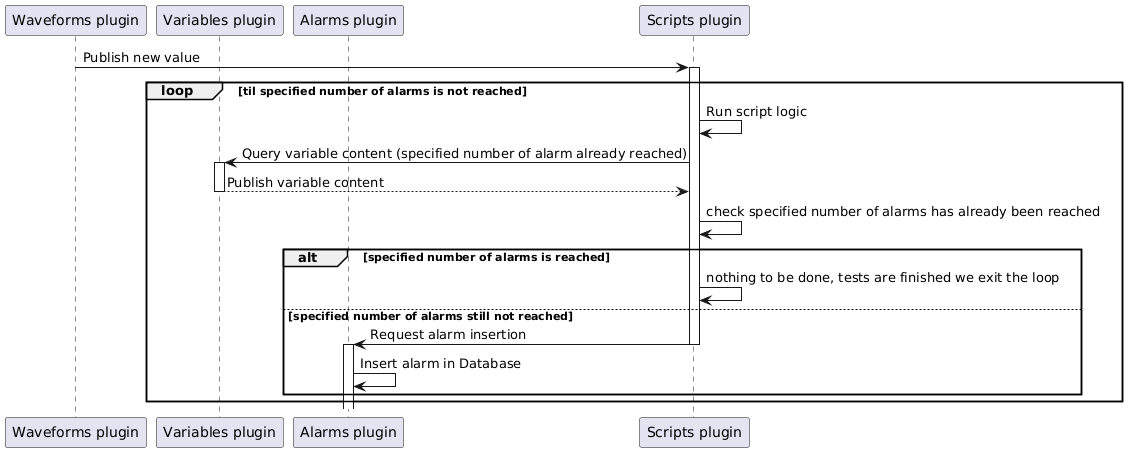
The Waveforms plugin will be used to generate a flow of new values to which the Scripts plugin will subscribe. Upon receiving those new values, it will request the Alarms plugin to create alarms. To generate only a specific number of alarms, the Variables plugin will be used.
Note
The following schema is an oversimplification of the actual processing taking place through the script. Its purpose is to help gain a quick understanding of what we are trying to achieve without dwelling on the implementation details. A more complete explanation is given in the Test example explanation.
Test example explanation
Note
The idea behind this test is to plot the elapsed time between consecutive alarms insertions. Values triggering those alarms insertions are periodic which means we should be able to find this period in the timestamp of alarms inserted in the database.
The Waveforms plugin periodically generates a value whose content is gradually incremented from 0 to a given maximum. Once this maximum is reached, the value is reset to 0 before being incremented gradually again, then reset to 0 and so on, creating a ramp signal. For more information on the waveforms plugin capacity.
The Scripts plugin will react to values published by the Waveforms plugin. For each value, it will request the Alarms plugin to insert alarms with a summary based on the content of the value which triggered its insertion.
Among the 4 collections used by the Alarms plugin, we are going to focus on the history collection. To ease its usage in our test results analysis, we would prefer if it only contained alarms matching one ramp period. To achieve this, we will use the Variables plugin. It will store one value indicating we started a new ramp and another indicating we already completed a full ramp (meaning no more alarm creation should be requested so that the history collection only contains alarms for one ramp).
The script processing (in root/scripts/generate-alarms/generate.js) has been heavily commented to help better understand it.
Run the test example configuration
Note
For this test to make any sense, it is recommended you run it on a freshly deployed stack, meaning a stack without any prior configuration.
You can deploy the test example configuration by checking out the stress-test-example branch.
Make sure the configuration you are working on is up to date
git pull
Checkout resources made available to you through the git example-stress-test branch
git checkout origin/example-stress-test -- .
Validate checkout resources with a proper message:
git commit -m "Add resources for self stress test"
Double check the configuration you are working on is up to date
git pull
Deploy the configuration including the checkout resources for self stress test
git push
Extract the test result
Connect on MongoDB docker
docker container ls
List the docker running on your stack
docker container ls
Note the Mongo DB container name (MONGO_DB_CONTAINER_NAME)
Connect on the docker
docker container exec -it MONGO_DB_CONTAINER_NAME /bin/bash
Dump the alarms history collection
Note
The test can take some time to run. If you did not modify the script or the waveform plugin configuration, it should not take more than 5 minutes for it to finish once you pushed the resources in the stress-test-example branch. If you changed the waveform plugin configuration, it can take a while longer depending on the values used. To make sure tests are done running, check the script container plugin logs. It should show “STOP CREATING ALARMS!!!!”.
Once you are sure the tests are finished, you can dump the history collection with the following:
mongoexport -d alarms -c history -o alarms-history.json
Download the dumped alarms history (locally, on your computer)
docker container cp MONGO_DB_CONTAINER_NAME:/alarms-history.json ./
Manipulation of test results to make them suitable for analysis
Make the result file content a JSON array:
When specifying to mongoexport that we want JSON output (alarms-history .json), mongoexport creates a file containing the alarms in JSON format. While the alarms themselves are serialized in JSON format, the file itself is not. To make it a proper JSON file, the file content must be transformed into a JSON array. For this, we only need to add brackets [] around the entries, one at the beginning and one at the end. Then, every line except the last must be appended with a comma. This can be done with any text editor.
Keep only alarms fields we are interested in:
To manipulate the freshly created JSON file, we will use a command-line tool: jq. (While we explain here how to use jq to do what we need, you can obviously use any tool you want to do the same.)
The only alarm fields we are interested in are summary and timestamp.
jq allows you to do so by running the following command:
cat alarms-history.json | jq '[.[] | {timestamp: .timestamp, summary: .summary}]' > alarms-filtered-field.json
Transform the JSON file into a CSV file
To manipulate our data, we are going to transform the JSON file into a CSV file which any basic spreadsheet program can understand. To do so, we will use a command-line tool: dasel. (While we explain here how to use dasel to do what we need, you can obviously use any tool you want to do the same.)
dasel -r json -w csv < alarms-filtered-field.json > alarms-filtered-field.csv
Compute elapsed time
The generated CSV file can be opened with any spreadsheet program. It contains:
1 increasing number
Xafter thetestSummary:text in the formtestSummary:X. This is the number generated by the Waveforms plugin and it has been embedded in the summary so that you can make sure entries are properly ordered (and order them if not, any basic spreadsheet program allows this)1 timestamp which we will call
TPwaveformsafter thetestSummary:X,text in the formtestSummary:X,TPwaveforms. This timestamp matches the time the valueXwas generated by the Waveforms plugin1 timestamp which we will call
TPscriptsin its own column. This timestamp was generated by the Scripts plugin when it called thealarm.createmethod
Create 2 new columns: one for the elapsed time between values generated by the Waveforms plugin, another for the elapsed time between requests to create alarms by the Scripts plugin.
Note
Timestamp inserted by the Scripts plugin is in nanoseconds, therefore the elapsed times computed from it can be divided by 1000000 to get a value in ms which will make more sens.
Test result analysis
Run on our machine, the plotted elapsed time give the following :
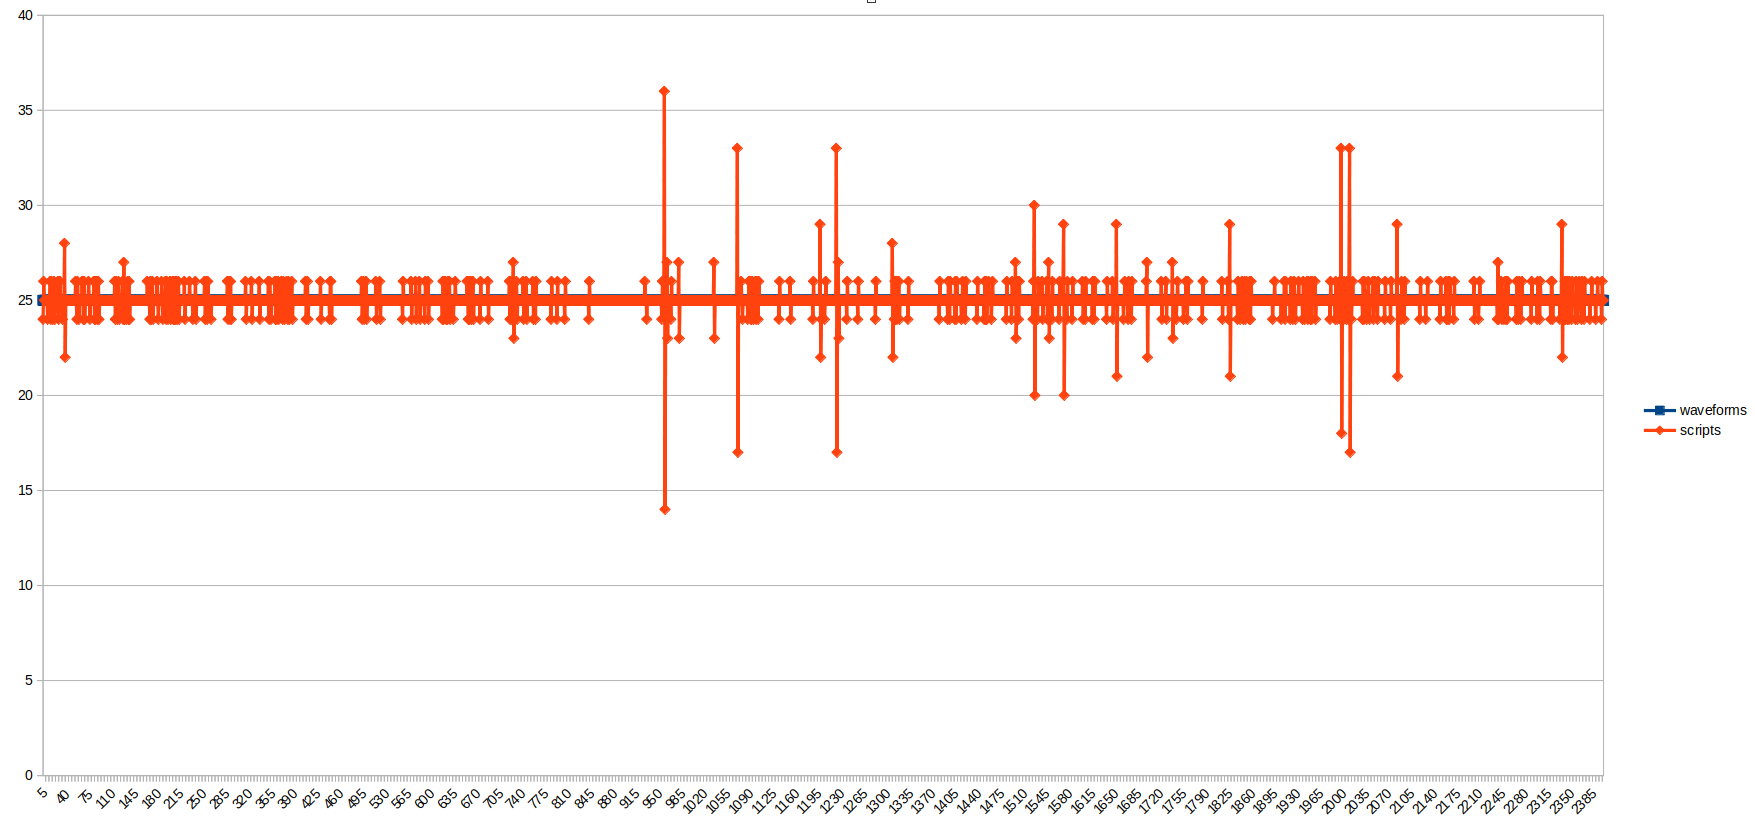
We can see the Waveforms plugin generated its values with a perfect 25ms period. The Scripts plugin called the alarm.create with an average interval quite similar, but we can see some peaks here and there. The average time between the moment the value is generated by the Waveforms plugin and the moment the Scripts plugin calls the alarm.create method is 2ms.
When analyzing these results, it is important to keep in mind:
Stress is generated internally (through the Waveforms plugin): resources which could have been used to handle stress were occupied generating it
All plugins were running on the same host: best-case scenario since no external network communication was needed
The alarm mechanism used for alarm insertion is the “Alarm creation request”: alarms created are never processed by the pre-insertion scripts, meaning less processing required (see module alarms for more information on alarm insertion mechanisms).
But more importantly, for this very specific test, remember that this test result is a collaboration between multiple very different plugins with very different mechanisms, and any pattern identified in the result can originate from any of the involved plugins.
To go further
Run this test with different values (changes needed in the Waveforms plugin configuration as well as in the
generate.jsscript)Test various alarms insertion mechanism (from script plugin, alarm.insert vs alarm.create, or test using snmp trap plugin)
Isolate mechanisms you are testing
Run this test while also running the
stressbinary
Initial deploy of the dispatcher fail
During the initial deploy, the dispatcher restart in a loop with an error message like:
Stack with name [<your stack name>] not found.
This indicate that the dispatcher was not able to find the stack on portainer.
If the stack exists on Portainer and the edition of the stack (editor to modify the compose file) is not available, this means that the stack was not deployed with Portainer.
For Portainer to be able to edit a stack, it must have created it. Otherwise, it doesn’t have the knowledge of the compose file used.
To fix it, remove the stack created and redeploy it with Portainer.
See the installation chapter, for more information.
MongoDB fail to start after update
During an update, MongoDB may fail to start due to a change in compatible features between two versions. In this case, a message like:
{
  "t": {
      "$date": "2025-01-27T08:27:20.215+00:00"
  },
  "s": "F",
  "c": "CONTROL",
  "id": 20573,
  "ctx": "initandlisten",
  "msg": "Wrong mongod version",
  "attr": {
      "error": "UPGRADE PROBLEM: Found an invalid featureCompatibilityVersion document (ERROR: Location4926900: Invalid featureCompatibilityVersion document in admin.system.version: { _id: \"featureCompatibilityVersion\", version: \"6.0\" }. See https://docs.mongodb.com/master/release-notes/7.0-compatibility/#feature-compatibility. :: caused by :: Invalid feature compatibility version value '6.0'; expected '7.0' or '7.3' or '8.0'. See https://docs.mongodb.com/master/release-notes/7.0-compatibility/#feature-compatibility.). If the current featureCompatibilityVersion is below 7.0, see the documentation on upgrading at https://docs.mongodb.com/master/release-notes/7.0/#upgrade-procedures."
  }
}
will appear on the log.
To solve this problem, the following steps are necessary:
Downgrade MongoDB to a previous version (for example: 1.3.0 -> 1.2.12).
On the MongoDB container, run the following command:
mongosh --eval "db.adminCommand( { setFeatureCompatibilityVersion: '7.0' } )"The version to choose depends on the current version. The log shows the currently set version
6.0and the version required to do the update'7.0' or '7.3' or '8.0'
Repeat the MongoDB upgrade.
One or more module start but hang
If a module fail or hang and display an exception like com.rabbitmq.client.ChannelContinuationTimeoutException, it is probably cause by the exhaustion of the RabbitMQ resource (memory or disk).
You can check it be running the following command:
The value of
Alarms,MemoryandFree Disk Spaceare the one to check. An alarm will indicate a problem that can cause the exception.Status of node rabbit@modules-rabbitmq-rabbitmq-1 ... Runtime ... Alarms (none) Memory Total memory used: 0.198 gb Calculation strategy: rss Memory high watermark setting: 0.8 of available memory, computed to: 1.718 gb ... Free Disk Space Low free disk space watermark: 0.5369 gb Free disk space: 4.295 gb ...If one or more have a state
blocked, this indicates that RabbitMQ will not process messages for this connection.Listing connections ... user peer_host peer_port state modules_alarms_alarms-1 10.20.5.129 40158 running modules_configuration-dispatcher_main 10.20.5.137 39484 running modules_analytics_analytics-1 10.20.0.176 55288 running modules_rights_rights 10.20.1.18 52898 running modules_collections_collections-1 10.20.0.177 56518 running modules_scripts_scripts-1 10.20.0.173 35780 running modules_web_web-1 10.20.141.220 59526 running modules_keycloak_keycloak-1 10.20.1.17 38476 running
More information can be found on the RabbitMQ alarm documentation.
My script is missing some execution
This problem often occurs due to a large number of triggers on a single script, therefore, you can change the parameters described in this section Backpressure and buffering.
My module has memory error
If the logs show some entry with:
java.lang.OutOfMemoryError: Java heap space
If the nodes have enough RAM available, the source of the problem is probably the container limits.
Either the limits are too low or the JVM is not configured porperly.
By default, the JVM will only use 25% of the RAM.
This can be override by setting the environment variable CUSTOM_JVM_OPTIONS with:
(recommended)
-XX:MaxRAMPercentage=75.0to use 75% of the avaible RAM as the maximum heap sizeWarning
You should never set this value to 100% because the JVM itself and some other process need some RAM.
We recommend this method because it dynamically follow the limits.
-Xmx1gto set the maximum heap size for the JVM.
The limit should be increased to at least match the load.