Display content as an iframe
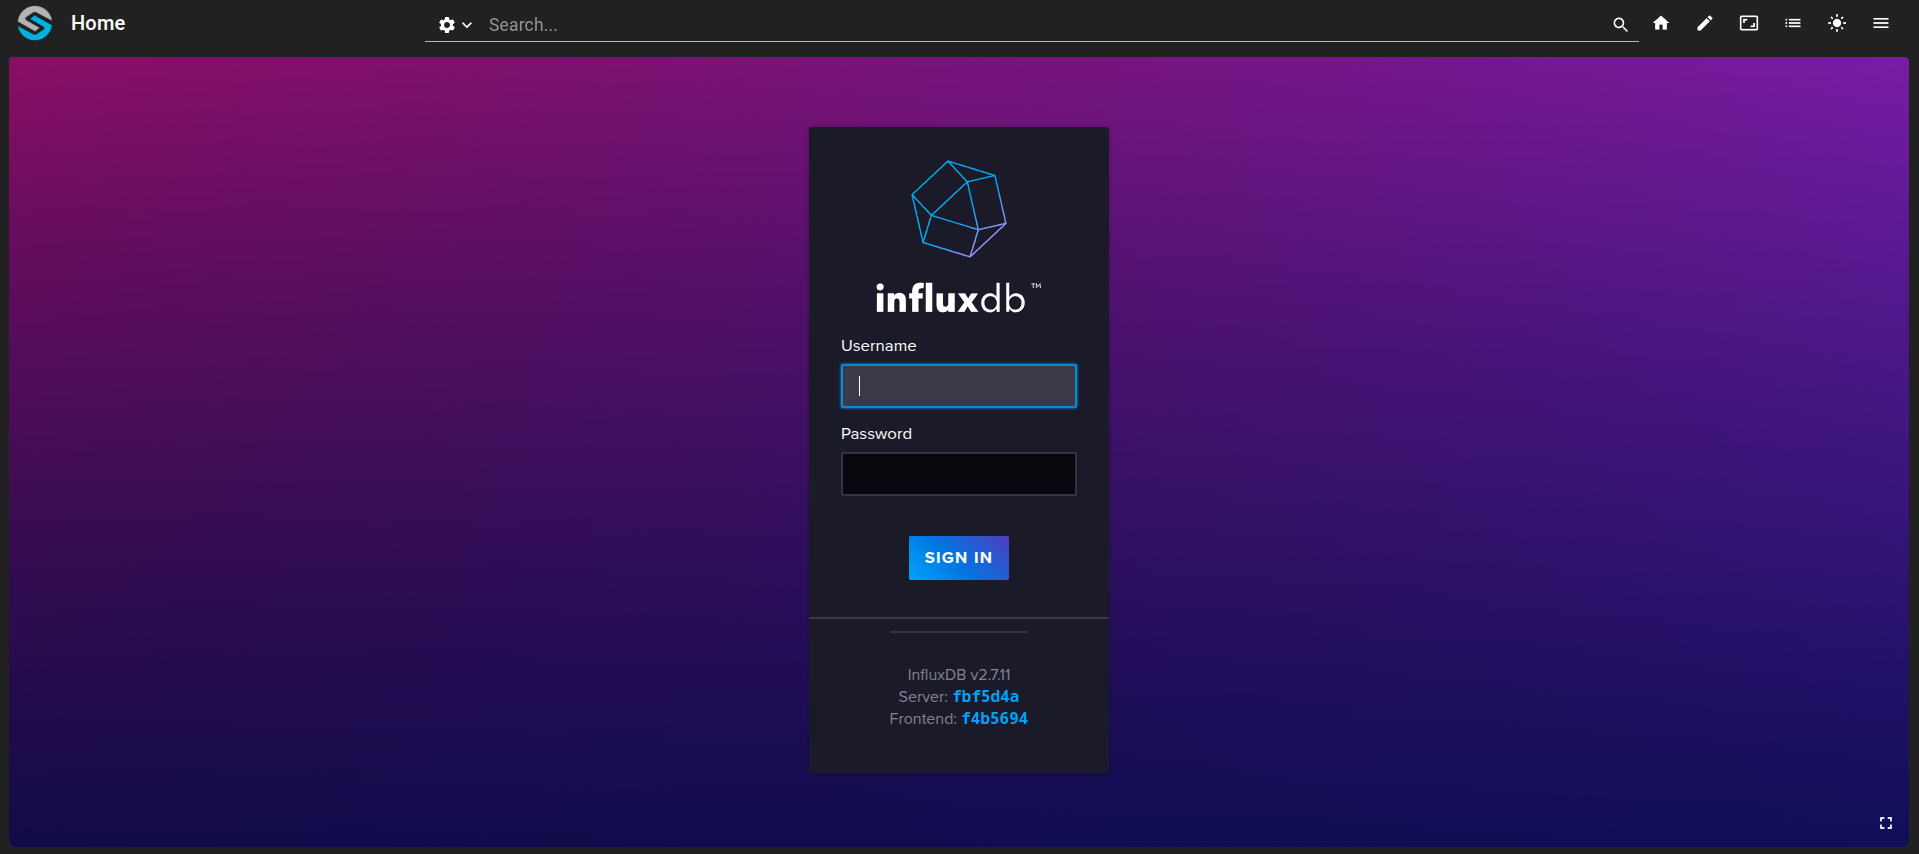
In this tutorial, you will learn how to add an iframe to a dashboard.
Expose an internal service port (e.g. InfluxDB on port 8086) via
module.serviceso the browser can load it.Define a Webview widget in
dashboard.viewwith the target URL as the iframe source.Ensure browser settings allow mixed HTTPS/HTTP content when the iframe source is HTTP.
Push the configuration and refresh the dashboard to display the embedded interface.
git checkout origin/osp-web-configuration .
git checkout origin/osp-analytics-configuration .
git checkout origin/example-dashboard-webview .
Steps
1. Expose the influxDB port
Warning
In this example, influxDB service is the source for our iframe. This means that the browser settings need to be set so that it accepts HTTPS and HTTP mixing.
modules/influxdb/influxdb-1/module.service
${{service-name}}:
  image: ${{image-repository}}osp-influxdb${{image-version}}
  restart: always
  networks:
    back:
      aliases:
        - osp-influxdb
  volumes:
    - "osp-influxdb-data-1:/var/lib/influxdb2"
    - "osp-influxdb-config-1:/etc/influxdb2"
  secrets:
    - source: ${{stackid}}_admin-pwd
      target: admin-pwd
    - source: ${{stackid}}_admin-user
      target: admin-user
Warning
To run this example it is necessary to expose influxDB so it can be loaded in the iframe. The ports parameter needs to be added in module.service file of influxDB :
ports:
   - 8086:8086
1. Define webview widget
root/dashboards/dashboard.web
{
    "configuration": [
        {
            "webViewWidgetSettings": {
                "source": "http://stack-1.onsphere.local:8086/",
                "title": "InfluxDB"
            },
            "id": "V952LJU1",
            "type": "WebView",
            "title": ""
        }
    ],
    "layout": {
        "lg": [
            {
                "w": 12,
                "h": 5,
                "x": 0,
                "y": 0,
                "i": "V952LJU1"
            }
        ]
    },
    "breakpoints": {
        "lg": 1200,
        "md": 996,
        "sm": 768,
        "xs": 480,
        "xxs": 0
    },
    "cols": {
        "lg": 12,
        "md": 10,
        "sm": 6,
        "xs": 4,
        "xxs": 2
    },
    "rowHeight": 150
}
Warning
The webview widget defined in the dashboard.view above uses http://stack-1.onsphere.local:8086/ to load the login page of influxDB. This address depends on the setup of the stack this example is deployed on.
1. Push the configuration to the osp-configuration-dispatcher
git add .
git commit -m "Add new webview widget"
git pull
git push
4. Refresh the dashboard
Note
When refreshing the first time, the web view will require you to login to influxDB to access its interface.