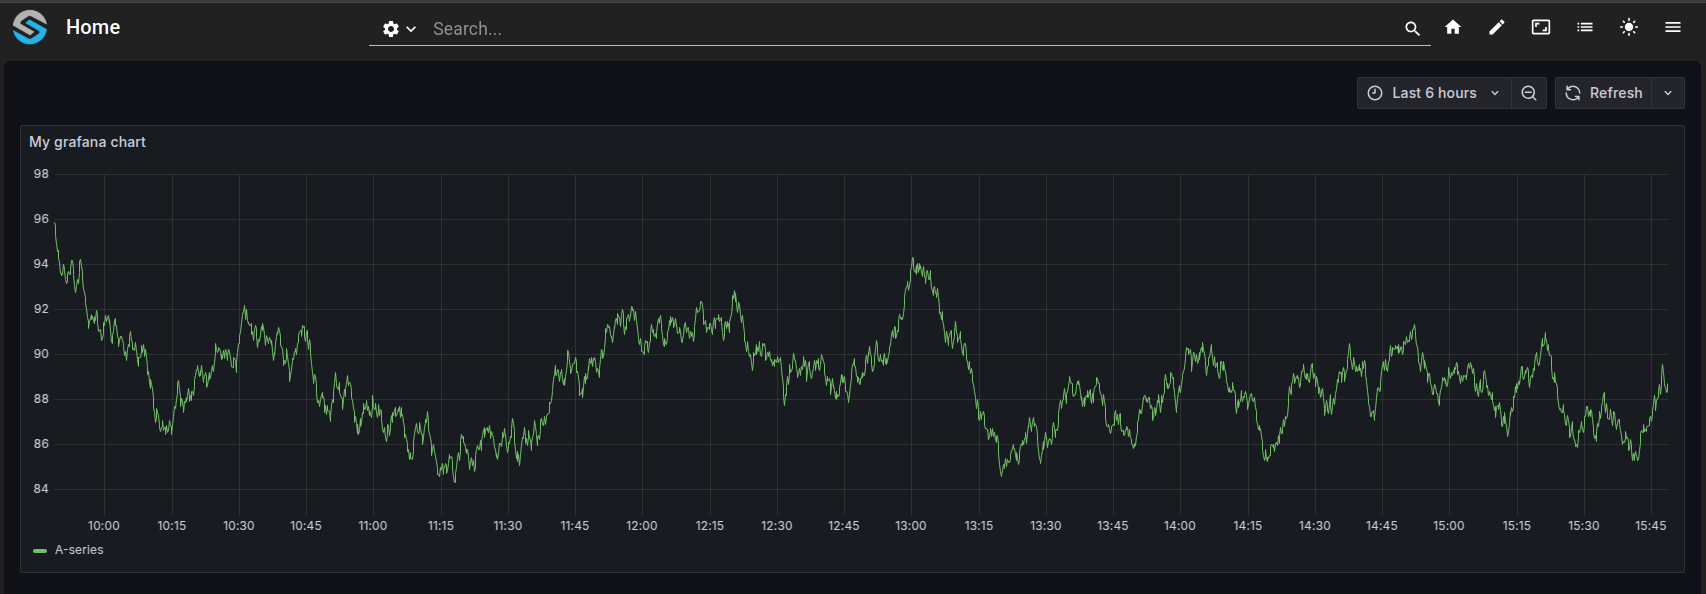
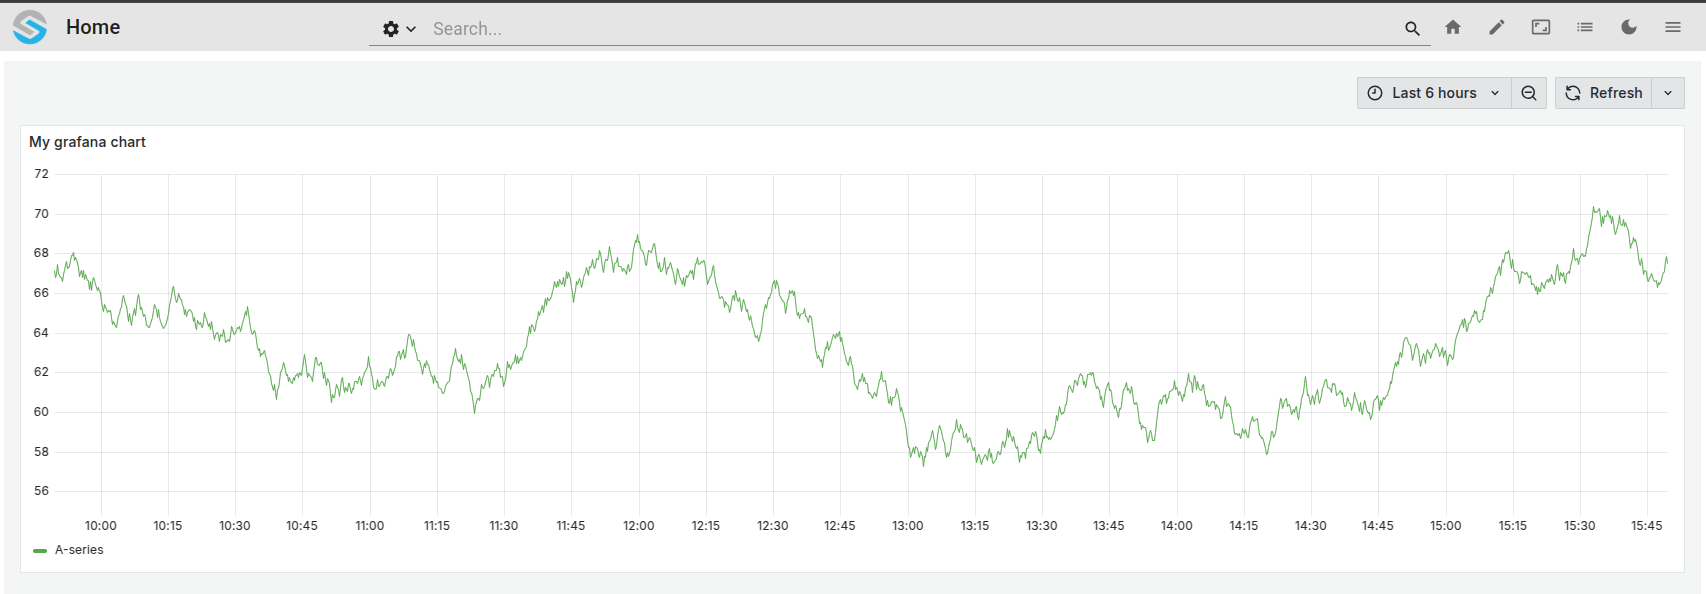
Visualize Grafana charts in the OSP web interface
This tutorial explains how to display Grafana dashboards and charts within the OSP web interface.
Configure the Grafana module and create a dashboard with charts inside Grafana.
Retrieve the Grafana dashboard URL from the browser address bar.
Embed the Grafana dashboard in an OSP dashboard using a Webview widget.
Use the
kioskandthemeURL parameters to adapt the appearance to the OSP interface.
git checkout origin/osp-web-configuration .
git checkout origin/osp-analytics-configuration .
git checkout origin/osp-grafana-configuration .
git checkout origin/example-dashboard-grafana-charts .
Steps
1. Setup Grafana
The Grafana module must be properly configured. Refer to Configure Grafana for detailed configuration instructions.
2. Create a new dashboard
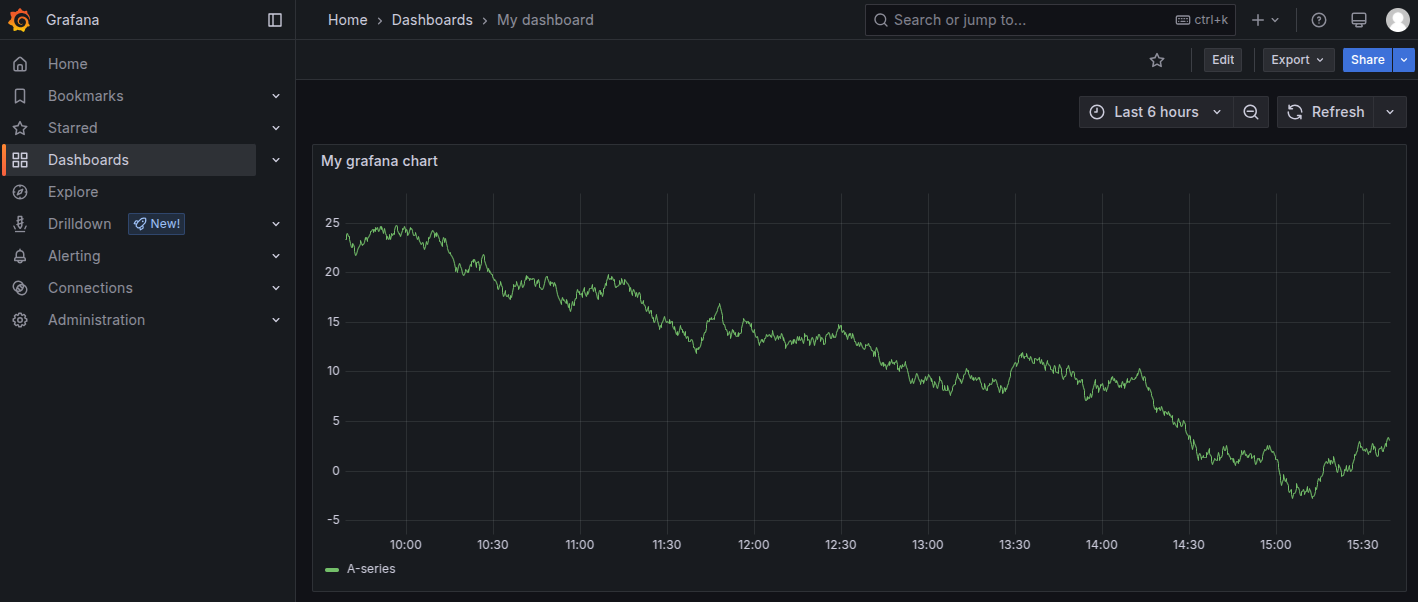
In Grafana, navigate to the Dashboards section, create a new dashboard, and add a chart.
Note
If the Dashboards section is not visible, verify the user permissions.
For more information on user permissions, see Manage users, groups, and permissions with Grafana.
3. Retrieve the Dashboard URL
Once inside the dashboard, copy the URL from your browser’s address bar. The URL format should resemble the following:
http://{stack_ip}:{stack_port}/d/1a2b3c4d5/dashboard-name?orgId=1&from=now-6h&to=now&timezone=browser
4. Create a new dashboard in the OSP web interface
Create a file named dashboard.view in the root directory.
Insert a Webview widget with the URL copied in the previous step.
You can append the kiosk parameter to the URL to hide the Grafana navigation menu.
Additionally, the theme parameter can be used to adjust the dashboard’s appearance according to the light and dark properties of the Webview widget.
root/dashboard.view
{
    "configuration": [
        {
            "id": "eQ2nVewc",
            "type": "WebView",
            "title": "",
            "webViewWidgetSettings": {
                "source": {
                    "dark": "https://stack-1.onsphere.local:5000/osp/grafana/d/eeie9u46iqmtca/my-dashboard?orgId=1&from=now-6h&to=now&timezone=browser&theme=dark&kiosk",
                    "light": "https://stack-1.onsphere.local:5000/osp/grafana/d/eeie9u46iqmtca/my-dashboard?orgId=1&from=now-6h&to=now&timezone=browser&theme=light&kiosk"
                }
            }
        }
    ],
    "layout": {
        "lg": [
            {
                "w": 12,
                "h": 5,
                "x": 0,
                "y": 0,
                "i": "eQ2nVewc"
            }
        ]
    },
    "breakpoints": {
        "lg": 1200,
        "md": 996,
        "sm": 768,
        "xs": 480,
        "xxs": 0
    },
    "cols": {
        "lg": 12,
        "md": 10,
        "sm": 6,
        "xs": 4,
        "xxs": 2
    },
    "rowHeight": 150
}
Also, create a file named dashboard.web in the root directory and include the following content:
root/dashboard.web
{
    "moduleId": "modules.web.web-1",
    "title": "Grafana charts dashboard",
    "description": "Example - Dashboard with Grafana charts",
    "tags": ["Grafana"]
}
5. Commit the Changes to osp-configuration-dispatcher
git add .
git commit -m "Add grafana dashboard to the web interface"
git pull
git push
6. Refresh the dashboard