Generate reports with Grafana charts
This tutorial provides instructions on how to generate reports using Grafana charts and display them within the OSP web interface.
Use a value with a callback and a JavaScript script to trigger Grafana chart report generation via a service token.
Configure
GRAFANA_SERVICE_TOKEN_TOKENandGRAFANA_CHART_RELATIVE_URLconstants in the script.Expose the Grafana dashboard through a Webview widget and add a ReportsViewer widget for download.
Add a menu action to allow users to download generated reports from the OSP interface.
git checkout origin/osp-web-configuration .
git checkout origin/osp-analytics-configuration .
git checkout origin/osp-grafana-configuration .
git checkout origin/osp-reports-configuration .
git checkout origin/osp-scripts-configuration .
git checkout origin/osp-variables-configuration .
git checkout origin/example-dashboard-reports-grafana-charts .
Steps
1. Create a value to trigger report generation
To create a report, a trigger must be used. In this case, a value is employed to trigger the report generation. A report will be generated each time the value changes.
Create a folder named
buttonin therootdirectory.Within the
buttondirectory, create subfolders namedgenerate-reportandscript.In the
generate-reportdirectory, create the following files:root/button/generate-report/value.ospp
{
    "name": "generate-report",
    "description": "A button component",
    "type": "BOOLEAN"
}
root/button/generate-report/owner.variables
{
    "moduleId": "modules.variables.variables-1",
    "default" : false
}
root/button/generate-report/callback.ospp
{
    "linkedOutputs": [
        {
            "outputId": "root.button.script"
        }
    ]
}
In the
scriptdirectory, create the following files:root/button/script/detached.scripts
{
    "accessedValues": [],
    "scheduledExecutions" : [],
    "sourceFile": "root/button/script/script.js",
    "moduleId": "modules.scripts.scripts-1"
}
root/button/script/output.scripts
{
    "scriptId": "root.button.script"
}
root/button/script/script.js
const GRAFANA_SERVICE_TOKEN_TOKEN = "glsa_COwgsh4pKkAqMr75m9kR0dpfteuWDaBn_609c2b78"
const GRAFANA_CHART_RELATIVE_URL = "/osp/grafana/render/d-solo/feihosddusirkd/new-dashboard?orgId=1&from=2025-04-23T02:48:03.400Z&to=2025-04-23T08:48:03.400Z&timezone=browser&width=600&height=300&kiosk=&panelId=1&__feature.dashboardSceneSolo";


const request_param = http.getRequest();

request_param.addHeader("Authorization", "Bearer " + GRAFANA_SERVICE_TOKEN_TOKEN);

request_param.setSocketTimeout(5000);

const request_result = http.doGet("http://osp-grafana:3000" + GRAFANA_CHART_RELATIVE_URL, request_param);

if (request_result.success) {
    console.log("Request successful");
}
else {
    console.log("Request failed");
    console.log(request_result.error);
}

const body_bytes = request_result.bodyBytes;
const base64 = encoder.base64Encode(body_bytes);

const headers = request_result.header;
const json_headers = JSON.parse(headers);
const content_type = json_headers["Content-Type"];

const result = reports.generate(
    "root.templates",
    "grafana_report",
    "en",
    "US",
    {
        "imgpath": "data:" + content_type + ";base64," + base64
    }
);

if(result.isSuccess()) {
    console.log("Report generated successfully");
}
else {
    console.log("Failed to generate report");
    console.log(result.getError());
}
In this script, two constants must be configured:
GRAFANA_SERVICE_TOKEN_TOKEN: Represents the Grafana API token. A new token can be generated via the Grafana web interface by navigating to Administration > Users and access > Service accounts. For detailed instructions, refer to the Grafana service accounts documentation.GRAFANA_CHART_RELATIVE_URL: Corresponds to the relative URL of the Grafana chart for which a report is to be generated. This URL can be obtained by accessing the desired chart in the Grafana web interface and copying the URL from the browser’s address bar. The relevant Grafana configuration will be created in a subsequent step of this tutorial.
3. Setup Grafana
The Grafana module must be configured properly. Refer to Configure Grafana for detailed instructions on configuration.
4. Create a new dashboard
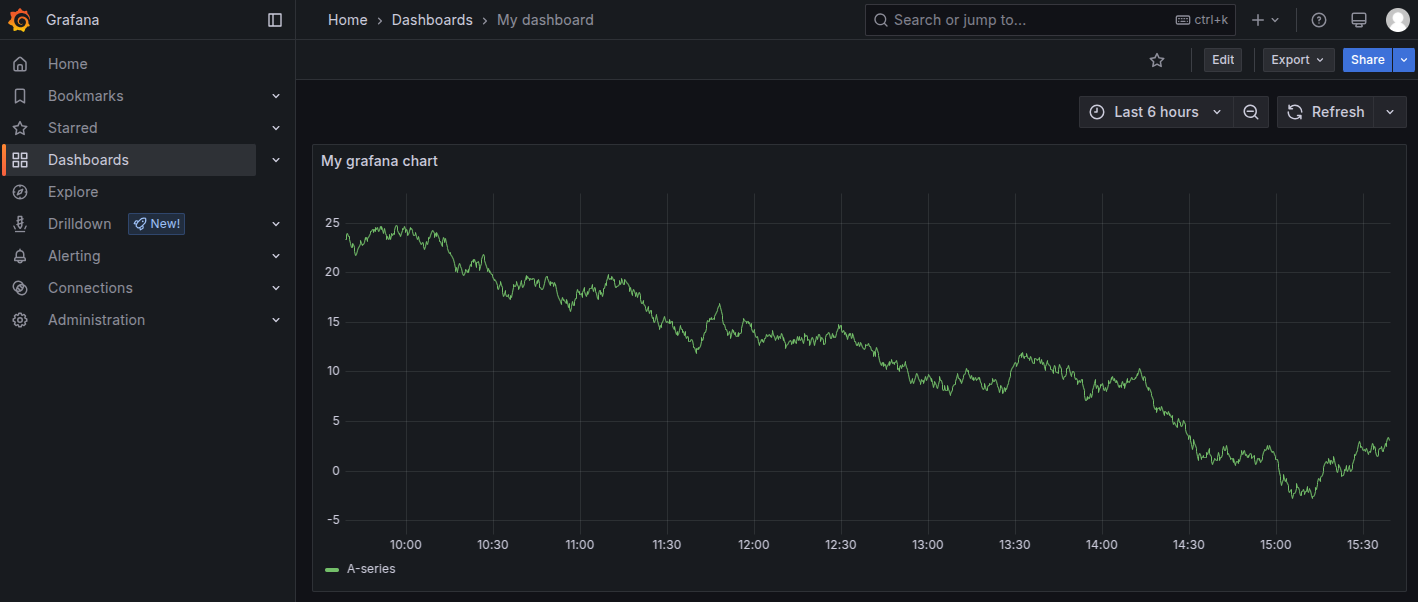
In Grafana, navigate to the Dashboards section, create a new dashboard, and add a chart.
Note
If the Dashboards section is not visible, verify the user permissions.
For more information on user permissions, see Manage users, groups, and permissions with Grafana.
5. Retrieve the Dashboard URL
Once inside the dashboard, copy the URL from your browser’s address bar. The URL format should resemble the following:
http://{stack_ip}:{stack_port}/osp/grafana/d/1a2b3c4d5/dashboard-name?orgId=1&from=now-6h&to=now&timezone=browser
Use this URL to configure both the Webview widget in the OSP web interface and the GRAFANA_CHART_RELATIVE_URL constant in the script. For the script, only the relative path portion of the URL must be used.
6. Add a Webview widget to the OSP web interface
Create a file named dashboard.view in the root directory.
Insert a Webview widget with the URL copied in the previous step.
You can append the kiosk parameter to the URL to hide the Grafana navigation menu.
Additionally, the theme parameter can be used to adjust the dashboard’s appearance according to the light and dark properties of the Webview widget.
7. Add a BasicInputOutputValue widget to the OSP web interface
Insert a BasicInputOutputValue widget in the dashboard to trigger the report generation.
8. Add a ReportsViewer widget to the OSP web interface
Insert a ReportsViewer widget in the dashboard to allow the user to view and download the generated reports.
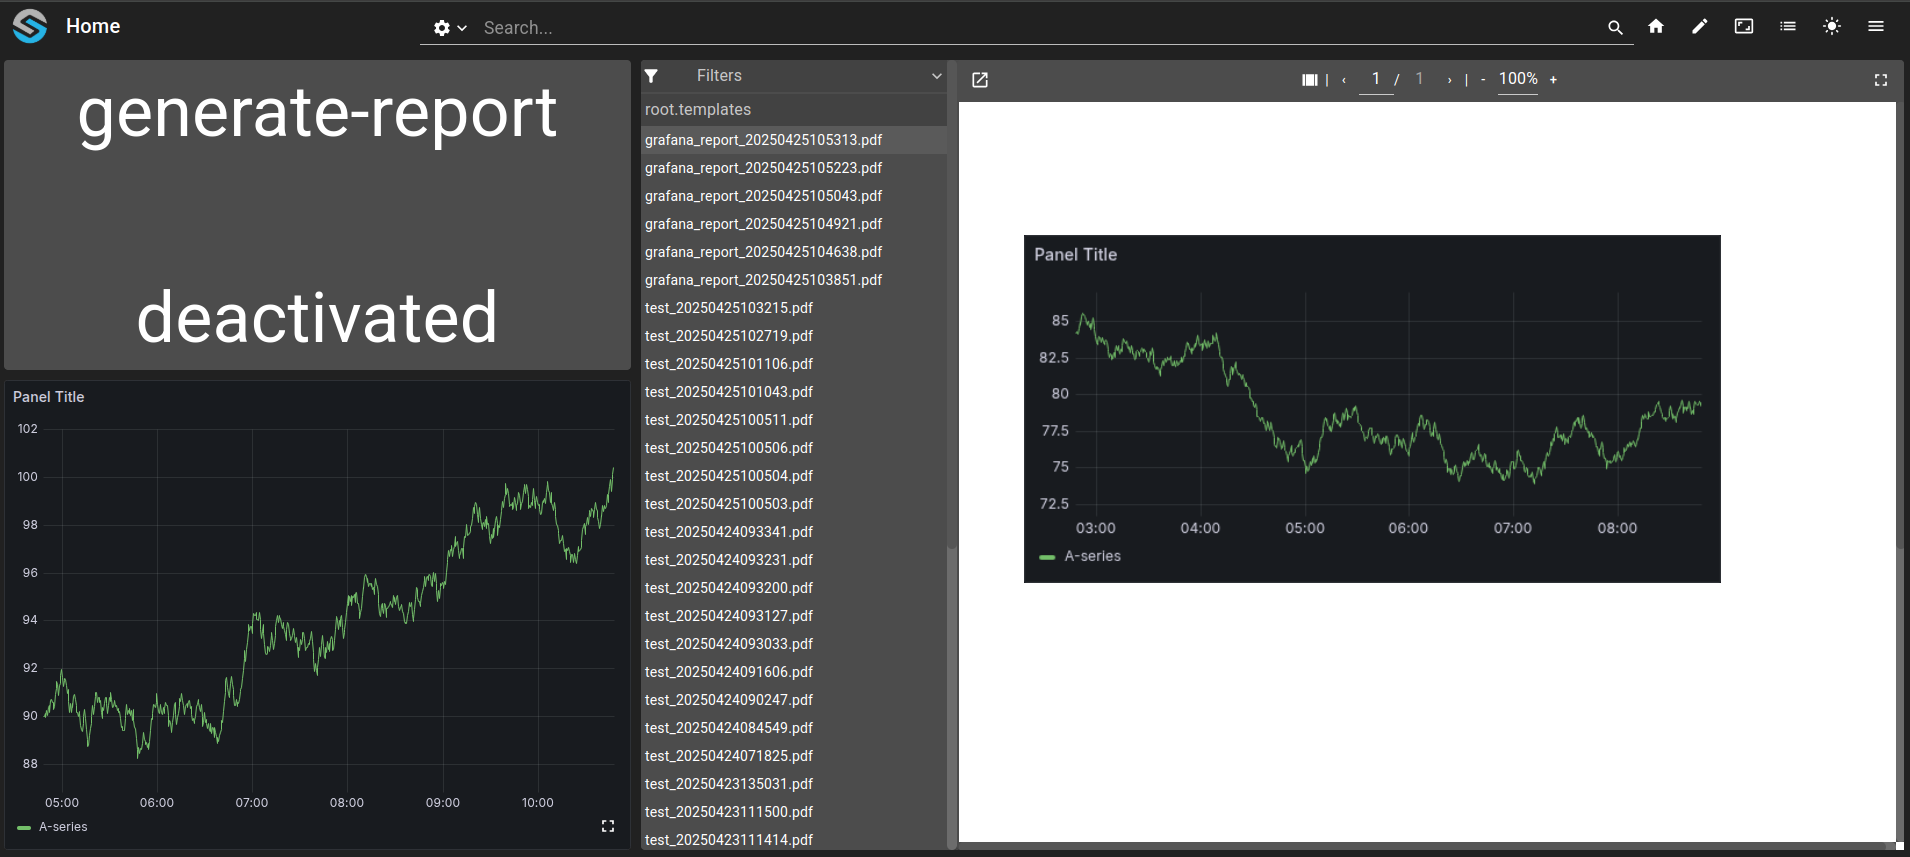
After creating the dashboard and adding the widgets, it should appear as follows:
root/dashboard.view
{
    "configuration": [
        {
            "type": "ReportsViewer",
            "id": "EvLTeHAX",
            "title": "",
            "reportsViewerWidgetSettings": {
                "layout": {
                    "listComponentWidth": 0.25,
                    "pdfViewerComponentWidth": 0.75
                },
                "list": {
                    "type": "ReportsList",
                    "id": "fadsadasd",
                    "menuReferences": [
                        "root.menus"
                    ],
                    "reportsListWidgetSettings": {
                        "templateSelect": {
                            "type": "ReportsTemplate",
                            "defaultOptions": [
                                "root.templates"
                            ],
                            "icon": "picture_as_pdf",
                            "multiple": true,
                            "limitTags": 2
                        }
                    }
                },
                "pdfViewer": {
                    "type": "PdfViewer",
                    "id": "gsdfasd",
                    "menuReferences": [],
                    "pdfViewerWidgetSettings": {
                        "windowOptions": {
                            "size": {
                                "width": 500,
                                "height": 500
                            },
                            "position": {
                                "left": 200,
                                "top": 200
                            }
                        },
                        "content": "",
                        "display": "one",
                        "zoom": 1
                    }
                }
            }
        },
        {
            "type": "BasicInputOutputValue",
            "id": "qMY9CfkX",
            "title": "",
            "valueSubscriptions": {
                "values": [
                    {
                        "id": "root.button.generate-report",
                        "type": "BOOLEAN",
                        "right": "READ_WRITE"
                    }
                ]
            },
            "basicWidgetSettings": {
                "showTooltip": true
            }
        },
        {
            "type": "WebView",
            "id": "vHlfk6GK",
            "title": "",
            "webViewWidgetSettings": {
                "source": "https://stack-1.onsphere.local:5000/osp/grafana/d-solo/feihosddusirkd/new-dashboard?orgId=1&from=2025-04-23T02:48:03.400Z&to=2025-04-23T08:48:03.400Z&timezone=browser&width=600&height=300&kiosk=&panelId=1&__feature.dashboardSceneSolo",
                "filterUrlRegexRules": [
                    "/osp/grafana/\\?"
                ]
            }
        }
    ],
    "layout": {
        "lg": [
            {
                "w": 8,
                "h": 5,
                "x": 4,
                "y": 0,
                "i": "EvLTeHAX"
            },
            {
                "w": 4,
                "h": 2,
                "x": 0,
                "y": 0,
                "i": "qMY9CfkX"
            },
            {
                "w": 4,
                "h": 3,
                "x": 0,
                "y": 2,
                "i": "vHlfk6GK"
            }
        ]
    },
    "breakpoints": {
        "lg": 1200,
        "md": 996,
        "sm": 768,
        "xs": 480,
        "xxs": 0
    },
    "cols": {
        "lg": 12,
        "md": 10,
        "sm": 6,
        "xs": 4,
        "xxs": 2
    },
    "rowHeight": 150
}
root/dashboard.web
{
    "moduleId": "modules.web.web-1",
    "title": "Home",
    "description": "OnSphere home",
    "tags": []
}
9. Commit the Changes to osp-configuration-dispatcher
git add .
git commit -m "Add dashboard with Grafana charts and reports"
git pull
git push
10. Refresh the dashboard