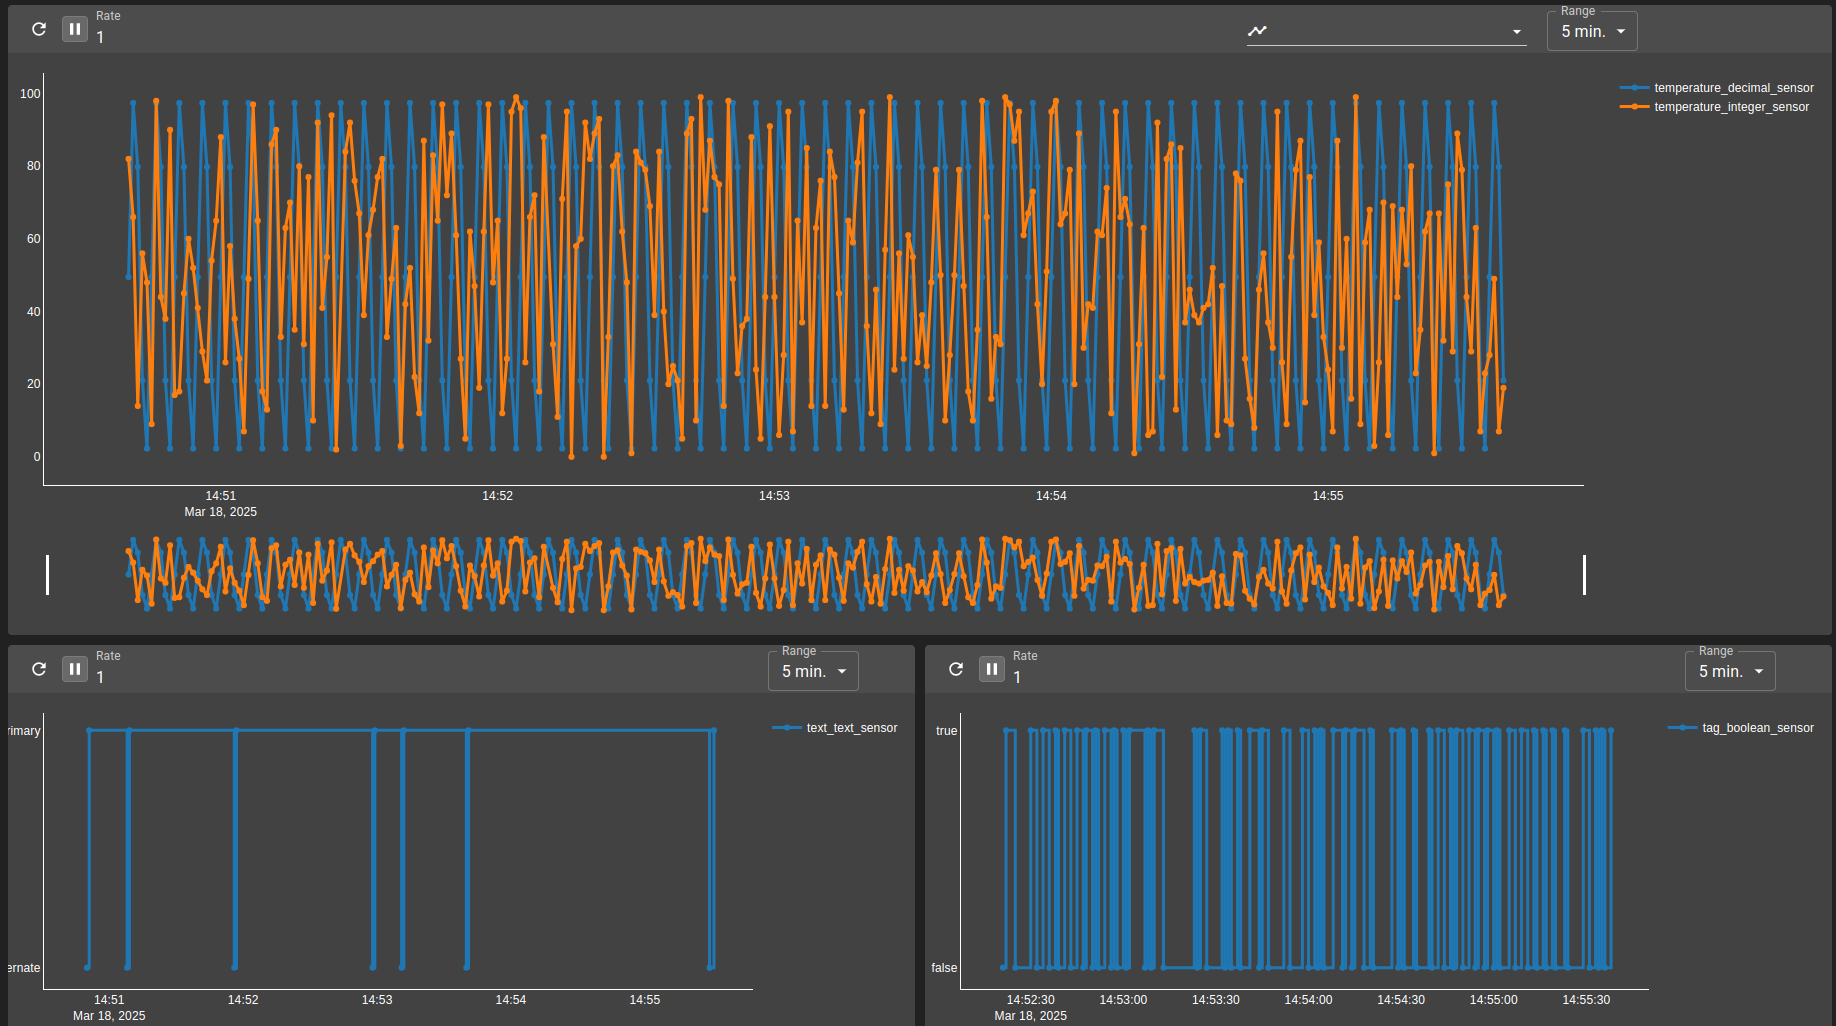
Visualize queries data within charts
In this tutorial, the goal is to display data on charts from the InfluxDB database.
Generate fake boolean, decimal, integer and text values using waveforms and detached scripts.
Store values in InfluxDB via
field.analytics,measure.analyticsandoutput.analyticsfiles.Define analytics queries (
query.analytics) to retrieve data for each chart type.Add chart widgets to a dashboard and bind them to the configured queries.
git checkout origin/osp-web-configuration .
git checkout origin/osp-analytics-configuration .
git checkout origin/osp-waveforms-configuration .
git checkout origin/osp-variables-configuration .
git checkout origin/osp-scripts-configuration .
git checkout origin/example-dashboard-charts .
Steps
1. Generate fake boolean values
Fake boolean values are generated using waveforms at a one second rate.
root/generator/waveforms/boolean/owner.waveforms
{
    "moduleId": "modules.waveforms.waveforms-1",
    "waveformConfigurationEntity": {
        "min": 0,
        "max": 1,
        "type": "DISCRETE_RANDOM",
        "seed": 12
    },
    "samplePeriod": {
        "unit": "SECONDS",
        "value": 1
    }
}
root/generator/waveforms/boolean/value.ospp
{
  "name": "boolean_sensor",
  "description": "Boolean sensor",
  "type": "BOOLEAN"
}
2. Generate fake decimal values
Fake decimal values are generated using waveforms.
root/generator/waveforms/decimal/owner.waveforms
{
    "moduleId": "modules.waveforms.waveforms-1",
    "waveformConfigurationEntity": {
        "min": 0,
        "max": 100,
        "type": "SINE",
        "period": {
            "unit": "SECONDS",
            "value": 5
        }
    },
    "samplePeriod": {
        "unit": "SECONDS",
        "value": 1
    }
}
root/generator/waveforms/decimal/value.ospp
{
  "name": "decimal_sensor",
  "description": "Decimal sensor",
  "type": "DECIMAL"
}
3. Generate fake integer values
To generate fake integer values, waveforms are used.
root/generator/waveforms/integer/owner.waveforms
{
    "moduleId": "modules.waveforms.waveforms-1",
    "waveformConfigurationEntity": {
        "min": 0,
        "max": 100,
        "type": "DISCRETE_RANDOM",
        "seed": 42
    },
    "samplePeriod": {
        "unit": "SECONDS",
        "value": 1
    }
}
root/generator/waveforms/integer/value.ospp
{
    "name": "integer_sensor",
    "description": "Integer sensor",
    "type": "INTEGER"
}
4. Generate fake text values
Fake text values are generated using a script. The script is linked to a value and the script is triggered by the detached script. The detached script is executed at a fixed rate defined by a cron expression (every seconds in this example).
See Scheduled executions for more information.
root/generator/variables/text/owner.variables
{
    "moduleId": "modules.variables.variables-1"
}
root/generator/variables/text/value.ospp
{
  "name": "text_sensor",
  "description": "Text sensor",
  "type": "TEXT"
}
root/generator/variables/text/script.js
const FIRST_VALUE = "Primary";
const SECOND_VALUE = "Alternate";
const VALUE_PATH = "root.generator.variables.text";

let random_value = Math.random() < 0.98 ? FIRST_VALUE : SECOND_VALUE;

values.update(VALUE_PATH, random_value);
root/generator/variables/text/detached.scripts
{
    "accessedValues": [
        "root.generator.variables.text"
    ],
    "scheduledExecutions": [
        "* * * * * ? *"
    ],
    "sourceFile": "root/generator/variables/text/script.js",
    "moduleId": "modules.scripts.scripts-1"
}
5. Store the fake values into the database
To store values, the analytics module is used therefore a field.analytics file is required for each value. The only information is to link the module used to store data (multiples modules can be used concurrency for performance, storage or confidentiality).
{
    "moduleId": "modules.analytics.analytics-1"
}
root/generator/waveforms/boolean/field.ospp
{
  "name": "boolean_sensor",
  "description": "Boolean sensor"
}
root/generator/waveforms/decimal/field.ospp
{
  "name": "decimal_sensor",
  "description": "Decimal sensor"
}
root/generator/waveforms/integer/field.ospp
{
    "name": "integer_sensor",
    "description": "Integer sensor"
}
root/generator/variables/text/field.ospp
{
  "name": "text_sensor",
  "description": "Text sensor"
}
A measure is defined to represent the group of values to which these data belong.
In this example, three measures are defined: tag, temperature, and text.
The tag measure is used to store boolean values, demonstrating how to use tags in InfluxDB.
The temperature measure is used to store decimal and integer values, showing how to store multiple values in the same measure.
The text measure is used to store text values.
{
    "moduleId": "modules.analytics.analytics-1"
}
root/analytics/output/tag/measure.ospp
{
    "name": "tag",
    "description": "tag"
}
root/analytics/output/temperature/measure.ospp
{
    "name": "temperature",
    "description": "temperature"
}
root/analytics/output/text/measure.ospp
{
    "name": "text",
    "description": "text"
}
The analytics output is then configured to store the different values inside the measure, using the field associated with each value. Each output corresponds to a bucket in the InfluxDB database. In InfluxDB, a bucket is a container for time series data, it has a retention policy.
Additional details can be found in the module documentation.
root/analytics/output/tag/output.analytics
{
    "moduleId": "modules.analytics.analytics-1",
    "bucket": "week",
    "tags": [
        {
            "name": "my_tag",
            "value": "my_value"
        }
    ]
}
root/analytics/output/temperature/output.analytics
{
    "moduleId": "modules.analytics.analytics-1",
    "bucket": "month",
    "tags": []
}
root/analytics/output/text/output.analytics
{
    "moduleId": "modules.analytics.analytics-1",
    "bucket": "year",
    "tags": []
}
A callback is required to insert the generated values into the InfluxDB database.
Each value has its own callback file, which refers to an output.
root/generator/waveforms/boolean/callback.ospp
{
    "linkedOutputs": [
        {
            "outputId": "root.analytics.output.tag"
        }
    ]
}
{
    "linkedOutputs": [
        {
            "outputId": "root.analytics.output.temperature"
        }
    ]
}
root/generator/variables/text/callback.ospp
{
    "linkedOutputs": [
        {
            "outputId": "root.analytics.output.text"
        }
    ]
}
6. Defining a query
Queries are used to retrieve data from the InfluxDB database.
In this example, three queries are defined: bool_chart, temperature_charts, and text_field. Each of these queries has a corresponding chart in the dashboard.
The collection field refers to the bucket in the InfluxDB database where the data is stored.
root/analytics/query/bool_chart/query.analytics
{
    "moduleId": "modules.analytics.analytics-1",
    "query": {
        "collection": "week",
        "range": {
            "start": {
                "value": 1,
                "unit": "HOURS"
            }
        },
        "measurements": [
            "root.analytics.output.tag"
        ],
        "fields": [
            "root.generator.waveforms.boolean"
        ],
        "limit": {
            "limit": 100
        }
    }
}
root/analytics/query/temperature_charts/query.analytics
{
    "moduleId": "modules.analytics.analytics-1",
    "query": {
        "collection": "month",
        "range": {
            "start": {
                "value": 1,
                "unit": "HOURS"
            }
        },
        "measurements": [
            "root.analytics.output.temperature"
        ],
        "fields": [
            "root.generator.waveforms.decimal",
            "root.generator.waveforms.integer"
        ],
        "limit": {
            "limit": 500
        }
    }
}
root/analytics/query/text_field/query.analytics
{
    "moduleId": "modules.analytics.analytics-1",
    "query": {
        "collection": "year",
        "range": {
            "start": {
                "value": 1,
                "unit": "HOURS"
            }
        },
        "measurements": [
            "root.analytics.output.text"
        ],
        "fields": [
            "root.generator.variables.text"
        ],
        "limit": {
            "limit": 500
        }
    }
}
root/analytics/query/bool_chart/query.ospp
{
    "name": "Week",
    "description": "Display week values"
}
root/analytics/query/temperature_charts/query.ospp
{
    "name": "Month",
    "description": "Display month values"
}
root/analytics/query/text_field/query.ospp
{
    "name": "Year",
    "description": "Display year values"
}
{
    "moduleId": "modules.web.web-1"
}
7. Push the configuration to the osp-configuration-dispatcher
git add .
git commit -m "Add new analytics query"
git pull
git push
8. Create a new dashboard
root/dashboards/dashboard.web
{
    "moduleId": "modules.web.web-1",
    "title": "Tutorial dashboard",
    "description": "Tutorial dashboard",
    "tags": ["Tutorial"]
}
root/dashboards/dashboard.view
{
    "configuration": [
    ],
    "layout": {
        "lg": []
    }
}
9. Push the configuration to the osp-configuration-dispatcher
git add .
git commit -m "Add new dashboard"
git pull
git push
10. Access to the dashboard
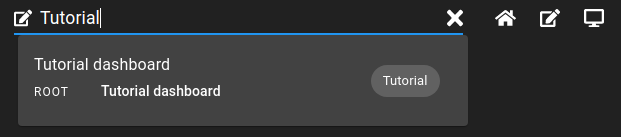
11. Click on the edit dashboard button and add a new “Chart” widget
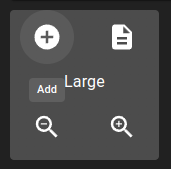
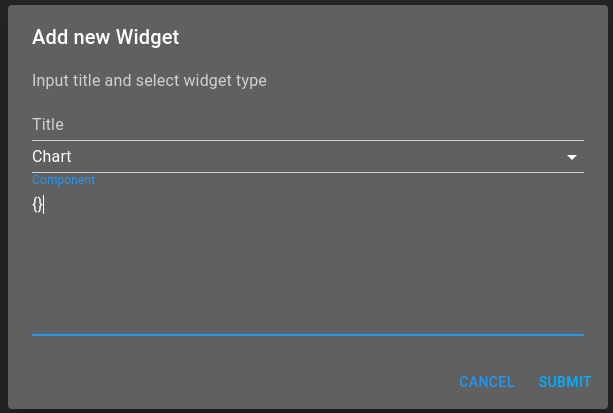
Click on the validate button.
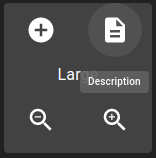
13. From the edit view, click on the description button and copy its content
After adding three charts and configuring them as needed, the result should look like this:
root/dashboards/dashboard.view
{
    "configuration": [
        {
            "type": "Chart",
            "id": "chartExample",
            "title": "Chart",
            "chartWidgetSettings": {
                "query": "root.analytics.query.temperature_charts",
                "type": "Line",
                "toolbar": {
                    "id": "chartExample_toolbar",
                    "title": "",
                    "type": "Toolbar",
                    "toolbarWidgetSettings": {
                        "type": "Chart",
                        "measureSettings": {
                            "type": "AnalyticsMeasure",
                            "icon": "device_hub",
                            "multiple": true,
                            "limitTags": 2,
                            "defaultOptions": [
                                "root.analytics.output.temperature"
                            ],
                            "includeOptions": [
                                "root.analytics.output.temperature"
                            ]
                        },
                        "displayAggregate": false,
                        "refreshSettings": {
                            "defaultAutoRefresh": true
                        },
                        "fieldSettings": {
                            "type": "AnalyticsField",
                            "icon": "timeline",
                            "multiple": true,
                            "limitTags": 2,
                            "includeOptions": [
                                "root.generator.waveforms.decimal",
                                "root.generator.waveforms.integer"
                            ]
                        }
                    }
                }
            },
            "options": {
                "userPreference": "LOCAL_STORAGE"
            }
        },
        {
            "chartWidgetSettings": {
                "query": "root.analytics.query.text_field",
                "type": "Line",
                "interpolation": "hv",
                "toolbar": {
                    "id": "uXGpvqh6_toolbar",
                    "title": "",
                    "type": "Toolbar",
                    "toolbarWidgetSettings": {
                        "type": "Chart",
                        "measureSettings": {
                            "type": "AnalyticsMeasure",
                            "icon": "device_hub",
                            "multiple": true,
                            "limitTags": 2,
                            "defaultOptions": [
                                "root.analytics.output.text"
                            ],
                            "includeOptions": [
                                "root.analytics.output.text"
                            ]
                        },
                        "displayMeasure": true,
                        "displayAggregate": false,
                        "refreshSettings": {
                            "defaultAutoRefresh": true
                        },
                        "fieldSettings": {
                            "type": "AnalyticsField",
                            "icon": "timeline",
                            "multiple": true,
                            "limitTags": 2,
                            "includeOptions": [
                                "root.generator.variables.text"
                            ]
                        }
                    }
                }
            },
            "id": "uXGpvqh6",
            "type": "Chart",
            "title": "interface"
        },
        {
            "id": "pVJWijFF",
            "type": "Chart",
            "title": "bool chart",
            "chartWidgetSettings": {
                "query": "root.analytics.query.bool_chart",
                "type": "Line",
                "interpolation": "hv",
                "toolbar": {
                    "id": "pVJWijFF_toolbar",
                    "title": "",
                    "type": "Toolbar",
                    "toolbarWidgetSettings": {
                        "type": "Chart",
                        "measureSettings": {
                            "type": "AnalyticsMeasure",
                            "icon": "device_hub",
                            "multiple": true,
                            "limitTags": 2,
                            "defaultOptions": [
                                "root.analytics.output.tag"
                            ],
                            "includeOptions": [
                                "root.analytics.output.tag"
                            ]
                        },
                        "displayAggregate": false,
                        "refreshSettings": {
                            "defaultAutoRefresh": true
                        },
                        "fieldSettings": {
                            "type": "AnalyticsField",
                            "icon": "timeline",
                            "multiple": true,
                            "limitTags": 2,
                            "includeOptions": [
                                "root.generator.waveforms.boolean"
                            ]
                        }
                    }
                }
            }
        }
    ],
    "layout": {
        "lg": [
            {
                "w": 12,
                "h": 4,
                "x": 0,
                "y": 0,
                "i": "chartExample"
            },
            {
                "w": 6,
                "h": 3,
                "x": 6,
                "y": 4,
                "i": "pVJWijFF"
            },
            {
                "w": 6,
                "h": 3,
                "x": 0,
                "y": 4,
                "i": "uXGpvqh6"
            }
        ]
    },
    "breakpoints": {
        "lg": 1200,
        "md": 996,
        "sm": 768,
        "xs": 480,
        "xxs": 0
    },
    "cols": {
        "lg": 12,
        "md": 10,
        "sm": 6,
        "xs": 4,
        "xxs": 2
    },
    "rowHeight": 150
}
14. Update the configuration to the osp-configuration-dispatcher
git add .
git commit -m "Add chart widget"
git pull
git push
15. Refresh the dashboard