Chart
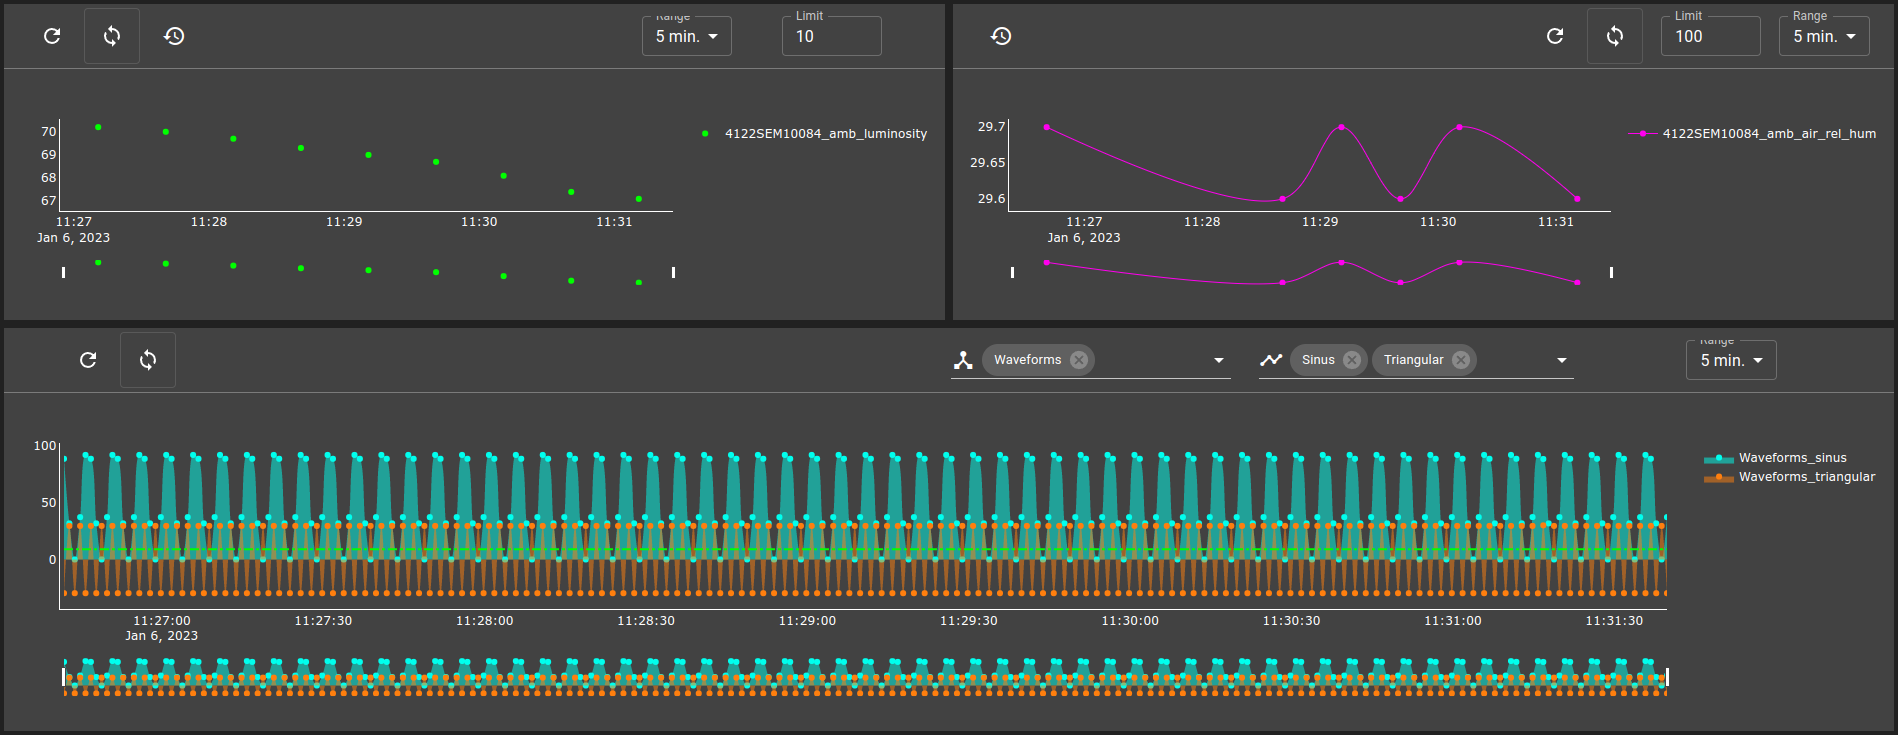
Chart widgets allow to display analytic query results.
Capabilities
Capability |
Support |
Comment |
|---|---|---|
Create charts based on recorded value |
|
See chart widget |

List of configuration files
Filename |
Short description |
Format |
Link to documentation |
|---|---|---|---|
dashboard.view#ChartWidget |
Defines the ChartWidget widget global settings |
json |
List of examples
Short description |
Link to documentation |
|---|---|
How to use a Toolbar widget to send actions to one or many charts. |
Interactions
Limit the data set see limit widget page for references
Chart dispositions
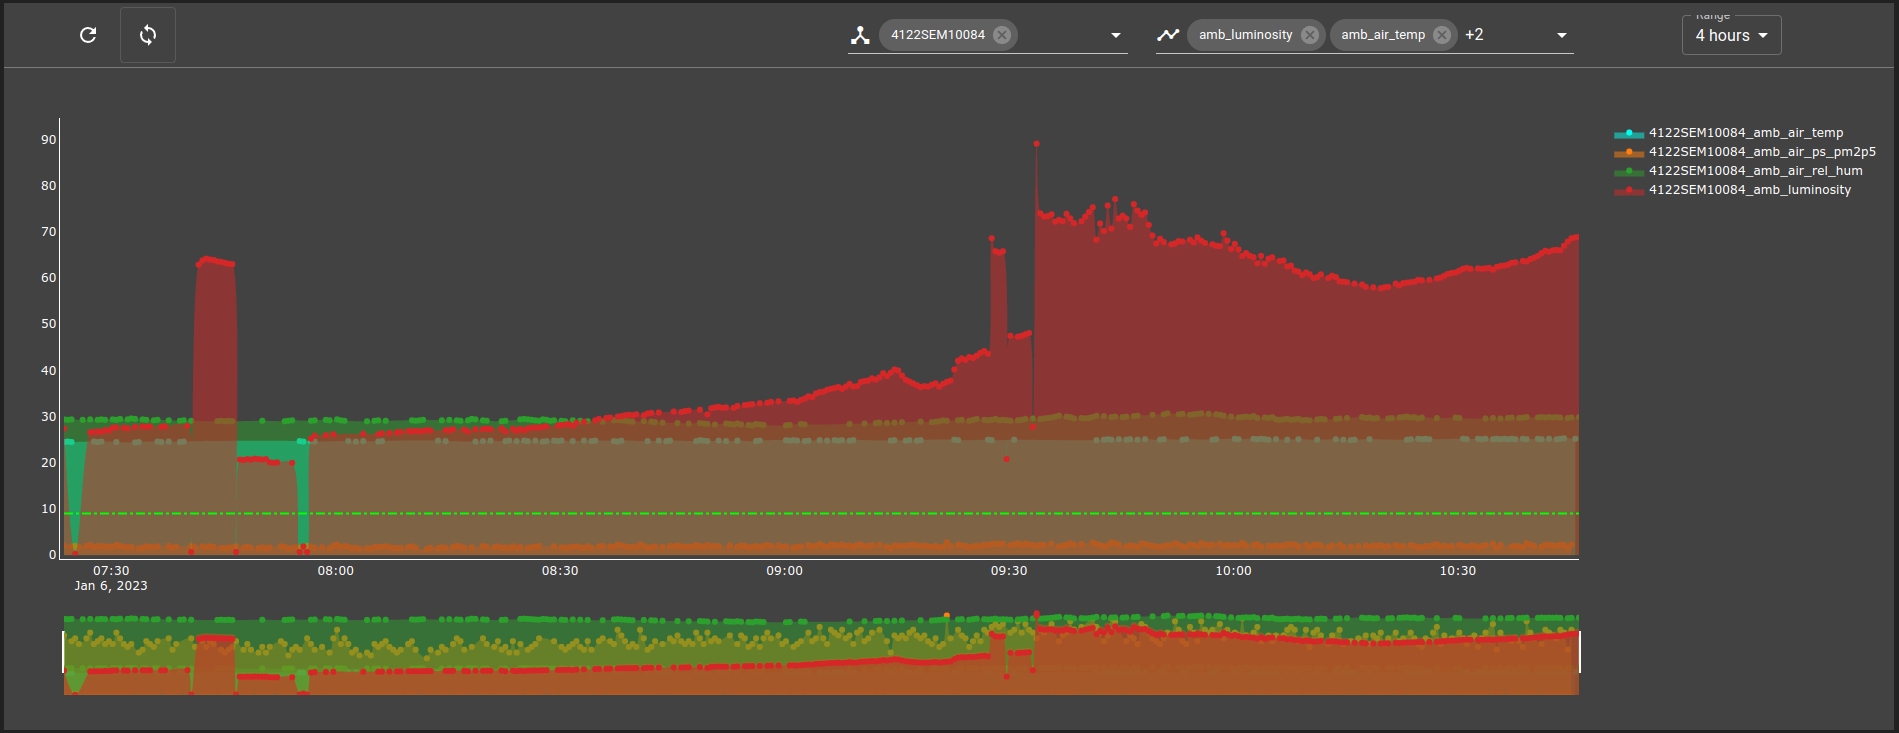
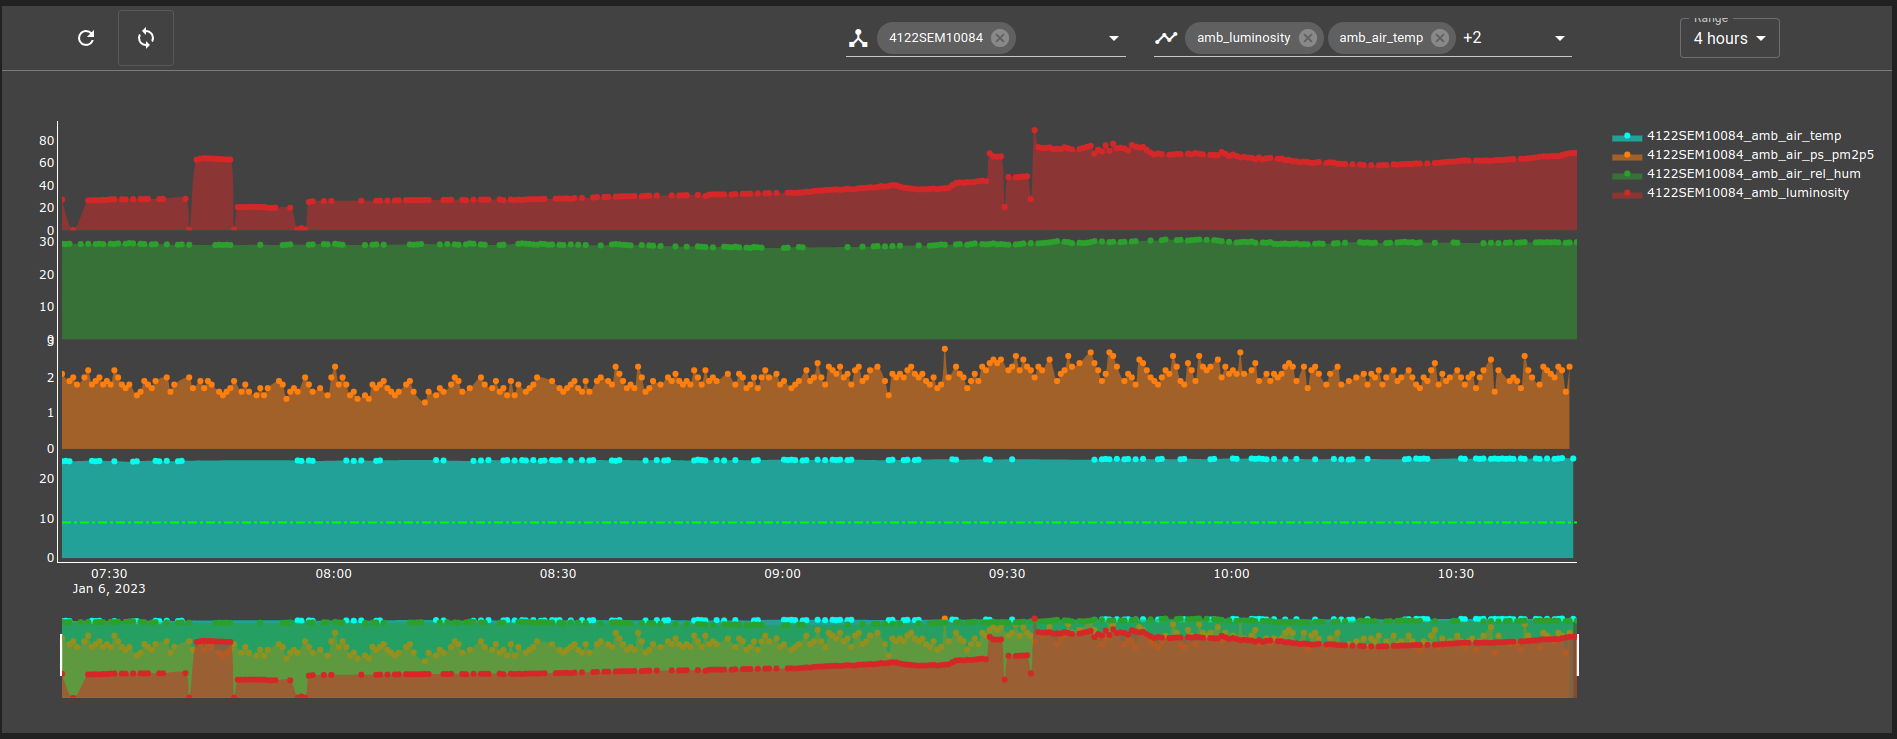
Chart widgets can dispose the values in two different ways:
Stacked (Default): Each line of values are displayed on top of each other
Separated: Each line is separated in another y axis
Use one of these dispositions according to the chart use case. Below an example of a chart once displayed Stacked and once displayed Separated.
Stacked
Separated
Editable mode
With editable as true, you can modify the chart titles and move the references lines as you want. These modification will stay on as the chart receive new data but not when the front is reloaded.
Widget Context
The widget context can be accessed from menus to fetch these different values from the widget:
chartquery: current query (ItemId)queryFilters: list of filters applied by this chart to the query (list)